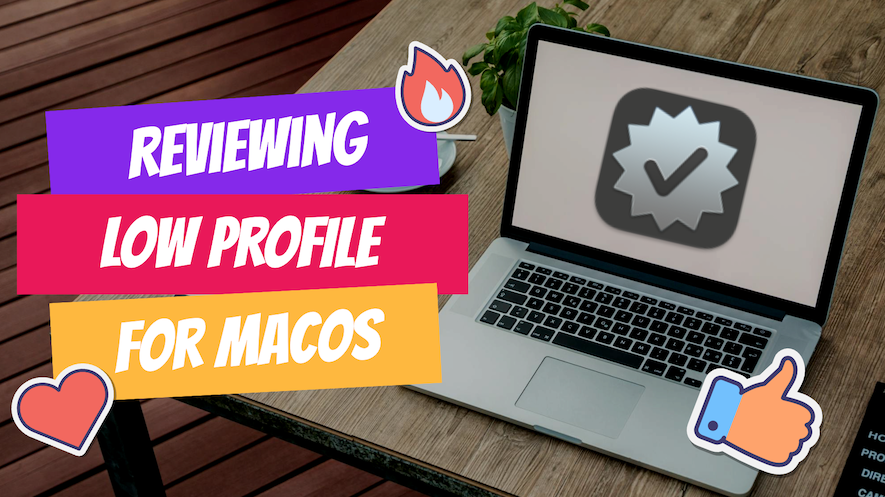

Today I’m walking through Low Profile, a utility from Nindi Gill that I use when I want to inspect profiles already installed on a Mac and figure out whether those profiles contain issues I need to clean up. The value is that Low Profile gives me a straightforward way to inspect profiles installed on any Mac.
One of the most common profile problems in the real world is conflict. You can end up with multiple profiles pushing the same settings, old settings that have been deprecated, or machines that still carry profiles from an earlier management workflow. Low Profile helps me surface those problems faster.
Resources and sources
If you want to use the utility yourself, start with the GitHub project and download it there.
Start With a Real Profile to Inspect
In the video, I start with Apple Configurator and a simple test profile. Likely you will just be using Low Profile on a Mac with pre-installed profiles.
In many environments, profiles are pushed automatically through an MDM, and it’s not always obvious what settings they contain just by looking at the profile name. Low Profile makes it easy to open those installed profiles and inspect the payloads, keys, and values that are actually being applied to the system.
This can be especially helpful when troubleshooting unexpected behavior, verifying that a policy was deployed correctly, or simply learning what a particular configuration profile is doing behind the scenes.
What Low Profile Detects
As soon you open Low Profile, it detects the installed profiles on the Mac that your running it on and lists them in the sidebar. Since I only have one profile installed on my example Mac, I only see one profile in the list.
That simple sidebar view is exactly what I want to see first. Before digging into payload details, I want a clear picture of which profiles are actually installed on the Mac. When multiple profiles are present, the sidebar makes it easy to move between them and inspect each one.
Inspecting the Profile
The useful part of the app is not just that it locates installed configuration profiles. It also lets me inspect the internal sections within them. In the example, I can move between areas like the general section and the restrictions section and review the details in each one. Low Profile also provides multiple ways to view the data for a given section, including the payload properties, the available properties, and the raw property list itself. That’s where the app becomes a true inspection tool: I’m not just confirming that a configuration profile exists, I’m examining how the payload is structured and what values it contains.
What the Issues View Is Telling Me
At the top of the interface, Low Profile reports the issues it has detected. In the example from the video, it flags several deprecated settings in the profile.
That is exactly the kind of feedback I want from a utility like this. Deprecated does not always mean the setting will instantly break the machine, but it does mean I should stop assuming that setting is the right one to keep pushing forward unchanged.
When Low Profile flags those settings, it is telling me I should go back to the source profile and clean it up.
Check for Duplicates
Another reason I use Low Profile is to look for duplicate entries and overlapping configuration. Profile conflicts are one of the easiest ways to create confusing behavior on a managed Mac, especially when multiple profiles are involved.
In the example from the video, there are no duplicates, which is a good result. But that is still useful because now I know that duplication is not the problem in this particular test case.
That is an important part of troubleshooting. Sometimes the value is finding the problem. Other times the value is ruling one out quickly so I can move on to the next likely cause.
What I Do After I Find a Problem
Low Profile is not the tool that fixes the profile. It is the tool that helps me inspect the profile and identify what needs to change.
If I find deprecated settings, duplicates, or conflicting payloads, the next step is to go back to the source and fix it there. That usually means:
- editing the original configuration profile
- updating the settings in MDM
- removing an older conflicting profile
- re-deploying a corrected version
That is how I use the app in practice. I use it to inspect what is on the Mac, identify the problem, and then go correct the actual profile source in my MDM.
Why This Utility Is Useful
What makes Low Profile useful is that it shortens the gap between “this Mac has profile-related problems” and “here is the exact profile content I need to review.”
Instead of guessing which payload might be causing trouble, I can open the app, inspect the installed profile, read the detected issues, and get a much more direct view into what is happening on the system.
If you work with profiles often or manage an MDM that deploys profiles, that kind of visibility saves time and makes troubleshooting cleaner.
Ready to take your Apple IT skills and consulting career to the next level?
I’m opening up free mentorship slots to help you navigate certifications, real-world challenges, and starting your own independent consulting business.
Let’s connect and grow together — Sign up here
AI Usage Transparency Report
AI Era · Written during widespread use of AI tools
AI Signal Composition
Score: 0.25 · Moderate AI Influence
Summary
Low Profile is a utility for inspecting profiles installed on a Mac, helping to identify issues such as deprecated settings, duplicates, and conflicting payloads.
Related Posts

When Chromium Mistakes Your VPN for a Local Network
Turning off Jamf Trust fixed the webinar, which normally would have sent me straight to its routing policies. This time the route was fine: Chromium was treating Jamf's ZTNA broker addresses as a local network, and an Edge and Chrome preference corrected it.

Amnesia Stealer Shows the Next Stage of ClickFix on macOS
Amnesia Stealer shows how ClickFix-style social engineering is adapting on macOS, while a public malware sample gives defenders an opportunity to study the behavior behind the campaign.
Apple Software Updates Need a Blueprint Before the MDM Commands Fade
Apple software update management is moving away from command-first MDM workflows. Jamf Blueprints and Declarative Device Management give Mac admins a better place to express update intent, scope, enforcement, and visibility.

Contour Brings Schema Checks to Mac Admin Configuration Work
Contour is a MacAdmins configuration toolkit that brings schema validation, repeatable generation, normalization, and AI-agent-safe command discovery to Apple configuration profiles, DDM declarations, PPPC, Santa, mSCP, Background Task Management, notifications, support app profiles, and osquery schema lookup.

Three Mac Update Helpers That Fit Below a Patch Platform
Latest, Applite, and an all-in-one macOS update script each solve a different part of lightweight Mac maintenance: app update visibility, Homebrew-backed app management, and command-line package updates that can be wrapped carefully for small teams or basic MDM.
Natural Makes the macOS Scroll Direction Toggle Less Buried
Natural is a small macOS menu bar utility that makes the natural scrolling toggle easy to reach, but building it from source also shows why open-source desktop utilities need clear prerequisite checks before they become recommended tools.

Why Mac Performance Monitor Belongs in the Mac Admin Toolbox
Mac Performance Monitor belongs in the Mac admin toolbox because it records local performance history, helps Help Desk review slow-Mac reports after the moment has passed, and keeps process telemetry on the Mac instead of sending it to a cloud service.

Jamf Moves Platform SSO Into the Enrollment Gate
Jamf's attended Simplified Setup for Platform SSO changes Mac enrollment by making identity registration part of Setup Assistant before the MDM profile is installed.

ClickLock Shows Why Terminal Paste Is a Mac Security Boundary
ClickLock Stealer shows why Mac security teams should watch for Terminal paste lures, fake AppleScript password prompts, command-line Keychain access, LaunchAgent persistence, and Jamf Protect alerts that can route suspected Macs into Jamf Pro response groups.
Deploying DDM OS Reminder 4.0.0 in Jamf
DDM OS Reminder 4.0.0 is deployed as two separate pieces in Jamf: a managed preferences profile and a one-time installer script that creates the reminder script, starter script, and LaunchDaemon heartbeat on the Mac.