Tracing a Mac Failure with Logger Utility


I spend a lot of time looking at macOS logs. Usually I know roughly when something broke, but I still have to get from “the Mac failed enrollment” to the few messages that explain which part failed. Logger Utility puts a visual filter, live stream, and row inspector over Apple’s unified log. I want to find the relevant messages before I ask an AI tool what they mean.
Start with the time it broke
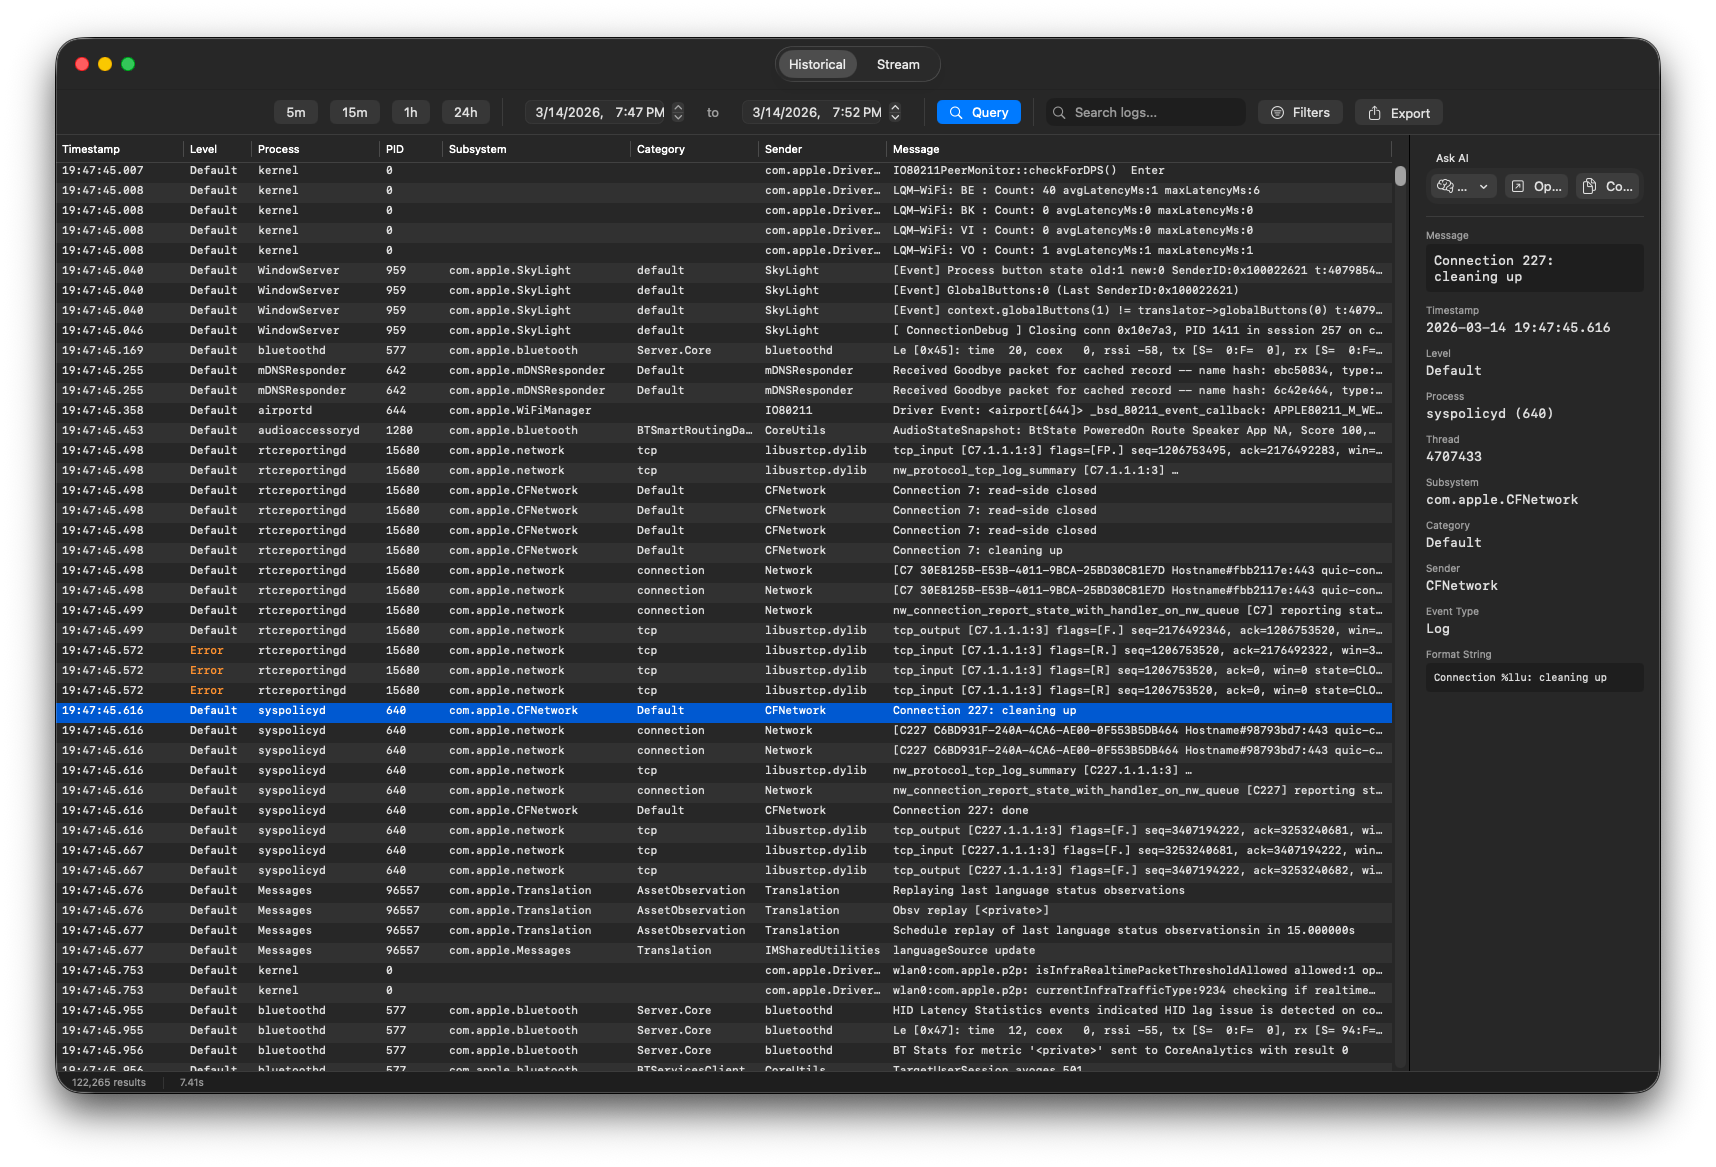
Say a Mac failed a management action during enrollment earlier this morning. I start in Historical, choose the incident time rather than a full day, and query the log. Logger Utility offers five-minute, 15-minute, one-hour, and 24-hour shortcuts plus custom dates.
The filter sidebar narrows by process, subsystem, category, sender, or log level. The visual predicate builder supports equality, inequality, contains, begins with, ends with, LIKE, and MATCHES. I may begin with a process, see which subsystem emitted the error, then add a second clause. The point-and-click builder saves me from retyping a log show command for each revision while querying the same Apple unified logging system.
In Terminal, I’d start the same search with:
log show --last 15m --style compact --predicate 'process == "mdmclient"'I’m searching for mdmclient events here. If I get too many rows, I add a subsystem or log-level filter and check the timestamps around the failure. If I get nothing, I widen the time window or remove a filter.
Logger Utility runs log as the signed-in user. Its v1.5.1 notes say standard users may see fewer system entries and cannot export a .logarchive with log collect. The app also warns when Full Disk Access is missing. I check both if the query returns fewer messages than I expect.
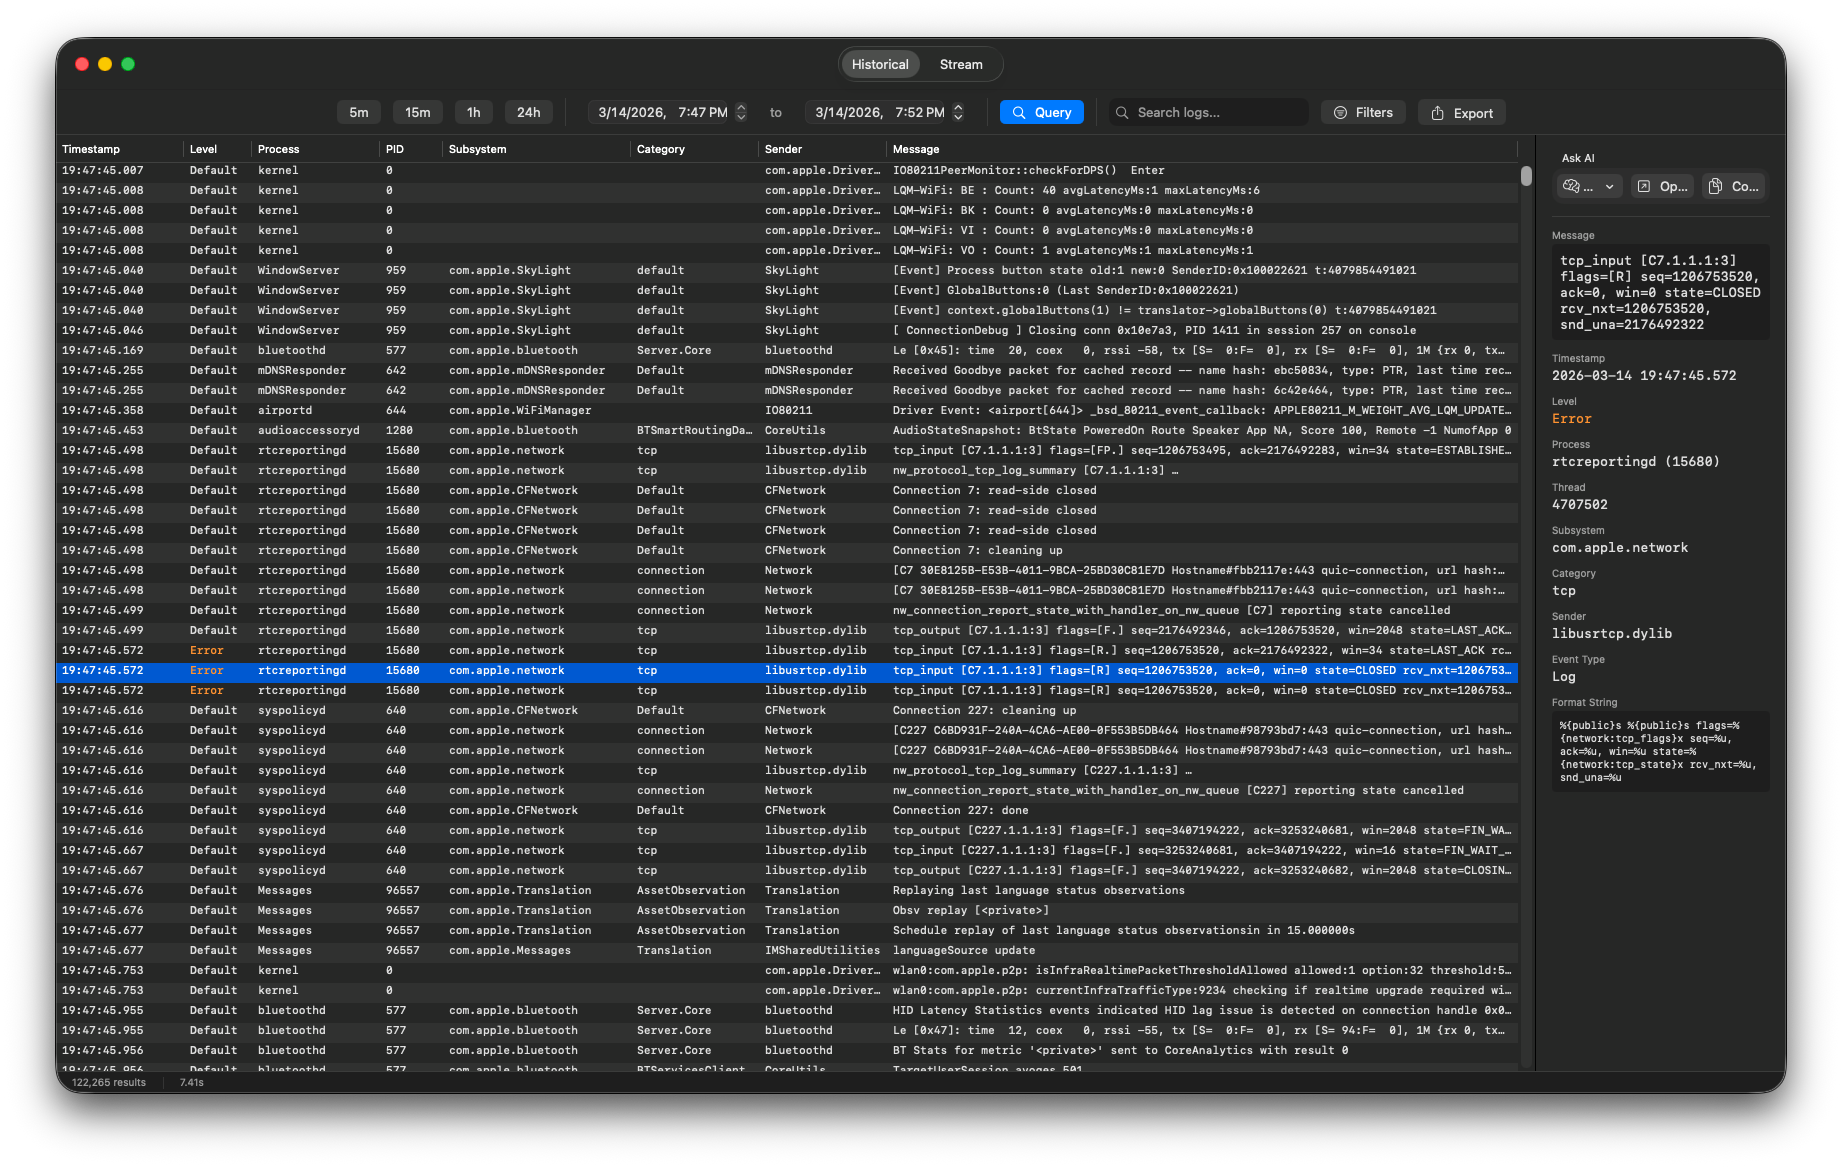
The detail inspector shows the selected entry’s process, subsystem, category, timestamp, and message. I can look back through earlier rows from the same process. Sometimes the message before the error tells me more about a certificate, network connection, account state, or MDM command than the error itself.
Watch the next attempt in Stream
When I can make the failure happen again, I switch to Stream and click Start. Search or Filters narrows the live rows, and I can click any entry for its details. Pause stops the display while the buffer continues to collect entries, so I can read a burst without losing the next few seconds of messages. The project’s streaming design runs log stream --style ndjson, reads each line on a background queue, parses the JSON, and publishes batches to the table every 100 milliseconds. A ring buffer holds at most 100,000 entries in memory.
I pause on the first error and read the messages leading up to it. Then I resume the display and try the enrollment again to see whether the sequence repeats.
What happens when I click Ask AI
Logger Utility’s README describes three ways to invoke Ask AI: right-click a row, use the inspector button, or press Command-Shift-A. The app builds a prompt from the selected log entries, copies it to the clipboard, and opens the chosen browser provider. It supports Perplexity, ChatGPT, Claude, Gemini, and Copilot; the app itself does not run a model. With Perplexity, the v1.3.1 release notes say the question can open prefilled in the browser URL.
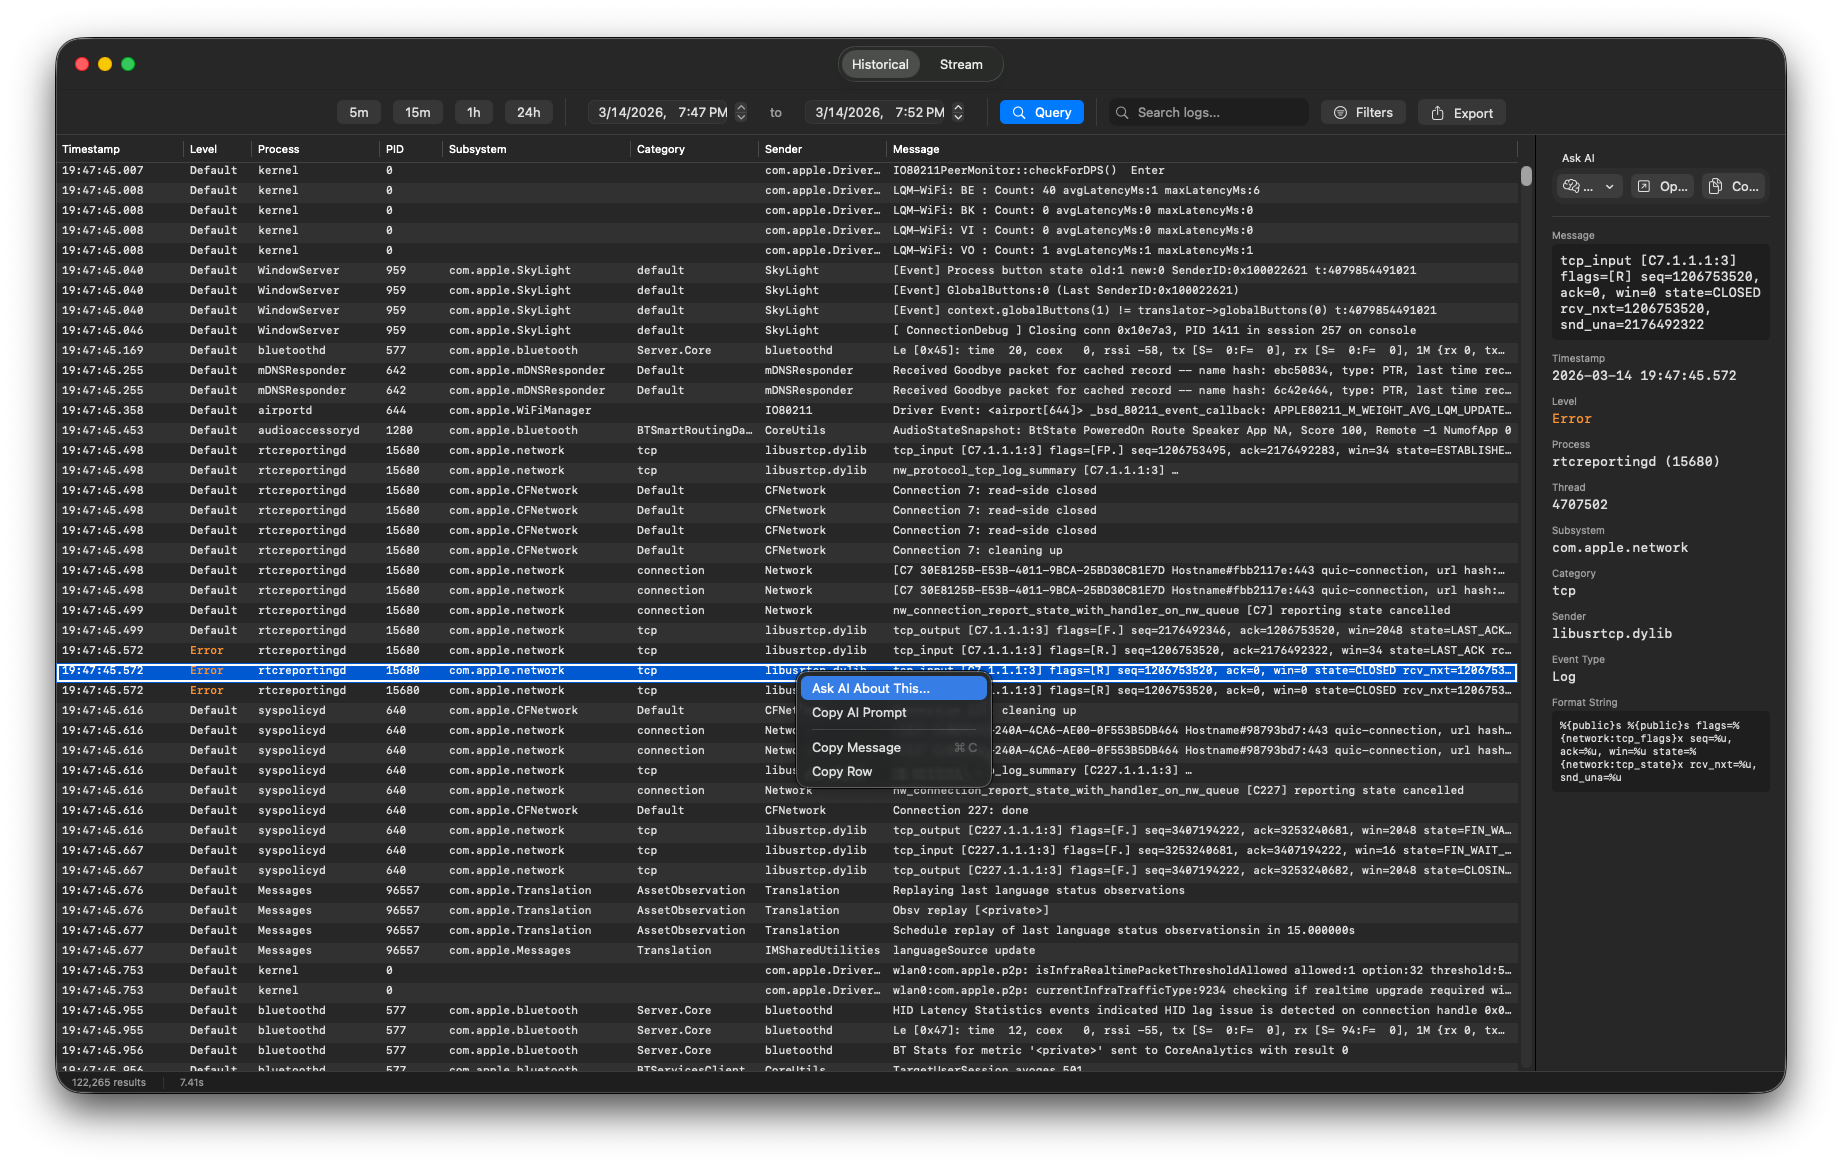
For logs you’re considering sharing with AI, I recommend using Copy Prompt in the detail panel and pasting the result into TextEdit first. Read it there, remove sensitive values, and check whether sharing what’s left with a browser assistant fits your company’s security and privacy practices.
Since v1.4.0, I can select several related rows around a failure instead of asking about one error in isolation. The prompt can include up to 50 entries, so I keep the selection tight.
Check the log text before it leaves the Mac
The rows I copy may contain hostnames, account names, application paths, or internal URLs. Apple can hide some values behind a <private> placeholder through privacy annotations in log messages. When Logger Utility shows <private>, the original value is not in that displayed row for an AI model to recover.
Sometimes I need the hidden value to troubleshoot. The project’s v1.5.3 release notes describe an EnablePrivateLogging.mobileconfig profile that can reveal those fields after installation and a restart. I would use it on one troubleshooting Mac and remove it when I finish, as the README recommends. Any newly visible values will also appear in later copied prompts and exports.
Keep the log on the Mac with Ollama
Logger Utility’s Ask AI button opens a browser provider. For a sensitive investigation, I would keep the log on the Mac. In Historical, I query the incident window, filter to the relevant process or subsystem, press Command-E, and export Plain Text. I save it as logger-export.txt in a working folder and leave that export untouched.
I typically use Ollama for local models. For this example, I’d choose Llama 3’s llama3:latest tag, about 4.7 GB if you need to download it. Install and open Ollama, then run ollama ls. If llama3:latest is already listed, skip the pull. Otherwise, download it once:
ollama pull llama3:latestPut logger-export.txt in a working folder and open Terminal in that folder. Run this separate block to read the existing export, send it to Ollama on 127.0.0.1, and save the answer as logger-report.md. It splits a busy export into small batches automatically; you do not need to re-export a four-second capture because it has too many messages. The Python code uses only the standard library.
python3 - <<'PY'
from pathlib import Path
from urllib import error, request
import json

source = Path("logger-export.txt")
if not source.is_file():
    raise SystemExit("Save a Plain Text export as logger-export.txt in this folder first.")

lines = source.read_text(encoding="utf-8", errors="replace").splitlines()
if not lines:
    raise SystemExit("logger-export.txt is empty. Export the incident window again.")

chunks = []
current = []
size = 0
for number, line in enumerate(lines, 1):
    # Preserve the original line number even when one log message is unusually long.
    for offset in range(0, max(len(line), 1), 5000):
        part = line[offset:offset + 5000]
        entry = f"{number}: {part}" if offset == 0 else f"{number} (continued): {part}"
        if current and size + len(entry) > 6000:
            chunks.append("\n".join(current))
            current, size = [], 0
        current.append(entry)
        size += len(entry) + 1
if current:
    chunks.append("\n".join(current))

def ask_ollama(prompt):
    payload = json.dumps({
        "model": "llama3:latest",
        "prompt": prompt,
        "stream": False,
        "options": {"num_ctx": 8192, "num_predict": 1800},
    }).encode("utf-8")
    call = request.Request(
        "http://" + "127.0.0.1:11434/api/generate",
        data=payload,
        headers={"Content-Type": "application/json"},
        method="POST",
    )
    try:
        with request.urlopen(call, timeout=1800) as reply:
            result = json.load(reply)
    except error.HTTPError as exc:
        raise SystemExit(f"Ollama returned HTTP {exc.code}: {exc.read().decode()}") from exc
    except error.URLError as exc:
        raise SystemExit("Cannot reach Ollama. Open the Ollama app and try again.") from exc
    answer = result.get("response", "").strip()
    if not result.get("done") or result.get("done_reason") != "stop" or not answer:
        raise SystemExit("Ollama cut off an answer; no report was saved. Retry or give the model more output room.")
    return answer

findings = []
for index, chunk in enumerate(chunks, 1):
    print(f"Reading log batch {index} of {len(chunks)}...", flush=True)
    findings.append(ask_ollama(f"""Analyze this part of a macOS unified-log export.
Report the relevant events with the ORIGINAL line numbers and timestamps, then
separate observations from possible causes and name useful next checks. Be brief.
Do not invent events or repeat account names, hostnames, or internal URLs.
If this part has no relevant evidence, say so. Log lines:\n{chunk}"""))

notes = "\n\n".join(f"Batch {i}:\n{item}" for i, item in enumerate(findings, 1))
if len(notes) <= 12000:
    print("Writing the combined report...", flush=True)
    report = ask_ollama(f"""Turn these batch findings into one troubleshooting report.
Give a summary, a timeline with original log line numbers and timestamps,
confirmed observations, plausible causes, next Mac-side checks, and remaining
gaps. Do not invent evidence or expose account names, hostnames, or internal URLs.
If batches disagree, say so. Findings:\n{notes}""")
    report += "\n\n## Batch findings for cross-checking\n\n" + notes
else:
    report = "# Log review by batch\n\nThe findings were too long for one final model pass. Review each batch against the numbered export.\n\n" + notes

Path("logger-report.md").write_text(report + "\n", encoding="utf-8")
print(f"Saved logger-report.md from {len(lines)} log lines in {len(chunks)} batch(es).")
PY
I ran it on a four-second export containing 1,571 lines. The script split that file into 34 batches and asked Llama 3 to review each one. Its batch findings exceeded the 12,000-character limit for the final combined pass, so logger-report.md contains all 34 batch responses rather than one summary. The script kept the original export untouched.
Here is the complete output from that run, with a local user path and one identifier masked. It is useful to see what the model actually returned: long stretches of AWDL, Wi-Fi, and background-process observations, plus possible causes that need checking against the original log. This run did not produce a single diagnosis. I would check any cited line in logger-export.txt before I used it in a ticket.
What Llama 3 returned
# Log review by batch

The findings were too long for one final model pass. Review each batch against the numbered export.

Batch 1:
Based on the log lines, I've extracted the relevant events, observations, and possible causes:

**Relevant Events:**

* Lines 1-5: Kernel messages related to setting up and monitoring AWDL (Apple Wireless Direct Link) state.
* Lines 6-15: AWDL statistics and monitoring.
* Line 20: LQM-WiFi (Low-Level Quality of Service) reporting.
* Lines 21-22: Wi-Fi Personal Area Network (PAN) discovery.
* Lines 23-24: mDNS (Multicast DNS) responses received.
* Lines 25-26: IGMP (Internet Group Management Protocol) version switching on interface en1.
* Lines 27-36: DuetExpertD (Apple's data transfer service) messages, possibly related to file handling and donation processing.

**Observations:**

* AWDL is enabled with no data connection.
* AWDL statistics indicate active time, signals, and signals-per-second.
* Wi-Fi PAN discovery is ongoing.
* mDNS responses are being received.
* IGMP version switching is occurring on interface en1.
* DuetExpertD is processing donations and handling file operations.

**Possible Causes:**

* AWDL enabling/disabling might be related to Wi-Fi connectivity or device sleep/wake cycles.
* Wi-Fi PAN discovery could be triggered by device proximity or user interaction.
* mDNS responses might indicate nearby devices or services being discovered.
* IGMP version switching could be caused by changes in network topology or device configuration.
* DuetExpertD's file handling and donation processing might be related to user activity or system maintenance.

**Next Checks:**

* Investigate AWDL state and statistics to determine the reasons for enabling/disabling.
* Examine Wi-Fi PAN discovery to determine the purpose of this activity.
* Analyze mDNS responses to identify nearby devices or services.
* Verify IGMP version switching to determine the cause of this activity.
* Monitor DuetExpertD's file handling and donation processing to understand the purpose of this activity.

Please note that these observations and possible causes are based on the provided log lines and might require further investigation to confirm or clarify.

Batch 2:
Here are the relevant events with original line numbers and timestamps:

**Events:**

1. **Connection establishment**:
	* Line 37: `duetexpertd` process is activating a connection to `com.apple.linkd.transcript`.
	* Line 38: The `linkd` process is accepting the connection from `duetexpertd` process.
2. **Error and connection cancellation**:
	* Line 47: An error occurs in `duetexpertd` process with the message "Data type not yet set for stream System, please switch to APIs that take eventDataClass as a parameter."
	* Line 48: Another error occurs in `duetexpertd` process with the message "Event class '<private>' missing from NSKeyedUnarchiver allowedClasses"
	* Line 49: The connection is invalidated because the process cancelled the connection.
3. **XPC connection invalidation**:
	* Line 50: The `linkd` process is notified that the XPC connection from `duetexpertd` process is being invalidated.
4. **Location-related events**:
	* Line 64: `duetexpertd` process is requesting location updates from `locationd` process.
	* Lines 65-71: `locationd` process is responding to the location requests.

**Possible causes:**

1. Incomplete or malformed data being sent over the connection.
2. Issues with the connection setup or tear-down.
3. Problems with the `duetexpertd` process's ability to send or receive data.

**Next checks:**

1. Verify the data being sent over the connection is complete and well-formed.
2. Check the connection setup and tear-down code in `duetexpertd` process to ensure it is functioning correctly.
3. Investigate issues with the `duetexpertd` process's ability to send or receive data, potentially by reviewing its code or debugging logs.

Batch 3:
**Relevant Events**

1. **Error**: The `cfprefsd` process (lines 97-102, 113-117) is unable to open certain files due to "No such file or directory" errors. This may indicate issues with file permissions, corruption, or non-existent files.

**Possible Causes**

* File system corruption or errors
* Incorrect file permissions or ownership
* Non-existent or deleted files
* Incomplete or failed file system operations

**Next Checks**

1. Verify file system integrity using `fsck` or other file system check tools.
2. Check file permissions and ownership using `ls` and `stat` commands.
3. Review system logs and event logs for any other errors or warnings that may be related to the file system issues.
4. Run disk utilities, such as `fsck` or `Disk Utility`, to detect and repair any file system errors.

If no other relevant events or issues are found, it may be necessary to investigate further or seek additional assistance to resolve the file system issues.

Batch 4:
Relevant events:

* Multiple error events (lines 118-130, 132-154) indicating that `cfprefsd` (the preference daemon) is unable to open a file or directory due to "No such file or directory". This suggests that a file or directory is missing or inaccessible.
* Other events:
	+ Lines 131, 133, 135, and 137-138: XPC (Cross-Process Communications) connections being established and invalidated, possibly related to the `cfprefsd` errors.

Observations:

* The `cfprefsd` errors are repetitive and occur in rapid succession, suggesting a problem with file access or permissions.
* The XPC connection events may be related to the `cfprefsd` errors, as they occur around the same time and involve similar processes.

Possible causes:

* File system corruption or issues with file access permissions.
* A missing or inaccessible file or directory that is required by `cfprefsd`.

Next checks:

* Check the file system for any issues or corruption.
* Verify the permissions and ownership of the file or directory in question.
* Check the system logs for any other errors or issues that may be related to the `cfprefsd` errors.

Batch 5:
**Relevant Events:**

1. **PID 28026 and 28027 connection issues**: Lines 160-163 and 165-168 show that multiple processes (cfprefsd, lsd, analyticsd) had their connections invalidated due to the client process (pid 28026 or 28027) either cancelling the connection or exiting.

**Possible Causes:**

1. **Connection issues or process crashes**: The invalidated connections might be due to processes crashing or terminating abnormally, causing connections to be terminated.
2. **System configuration or software issues**: The multiple processes affected might be related to system configuration or software issues, such as software conflicts or misconfigured settings.

**Useful Next Checks:**

1. **System logs**: Inspect system logs to see if there are any other relevant events or errors around the same time.
2. **Process monitoring**: Monitor the processes involved (cfprefsd, lsd, analyticsd) to see if they continue to have issues or if other processes are affected.
3. **System configuration**: Review system configuration and software settings to identify potential issues or conflicts.

**No significant observations or relevant evidence beyond the connection issues.

Batch 6:
**Relevant Events:**

1. **Timestamp:** 2026-11-01 17:06:54.418 (lines 205, 208, 211, 214, 216, 219, 222, 225, 228, 231, 234, 236, 239, 242, 243, 244, and 246)
**Event:** Default dasd[622] [com.apple.duetactivityscheduler:scoring] - multiple occurrences of this event with varying IDs and policies

2. **Timestamp:** 2026-11-01 17:06:54.420 (lines 247, 249)
**Event:** Default cfprefsd[645/978] [com.apple.xpc:connection] - activating connections

3. **Timestamp:** 2026-11-01 17:06:54.420 (line 250)
**Event:** Error - Couldn't open <private> due to No such file or directory

**Observations:**

* The events in this log extract appear to be related to the Duet Activity Scheduler and Spotlight Knowledge Domain, which are part of the Photos app on macOS.
* There are multiple occurrences of the same event (Default dasd[622] [com.apple.duetactivityscheduler:scoring]) with varying IDs and policies, indicating that the Photos app is processing various pieces of data.
* The cfprefsd process is involved in activating connections, which could be related to preferences or user settings.
* There is an error event indicating that a file could not be opened due to a "No such file or directory" error.

**Possible Causes:**

* Issues with the Photos app or its dependencies (e.g., Duet Activity Scheduler, Spotlight Knowledge Domain)
* Problems with file access or permissions
* Configuration or user settings issues

**Next Checks:**

* Investigate the Photos app's configuration and settings to ensure they are correct and consistent.
* Check the file system for any issues with file access or permissions.
* Review system logs and event logs to see if there are any other related errors or issues.
* Check for any software updates or patches that may be relevant to the Photos app or its dependencies.

Batch 7:
**Relevant Events:**

* 254-257: `cfprefsd` processes couldn't open `<private>` due to "No such file or directory" errors. These events may be related to issues with the Preferences framework or files.

**Observations:**

* The log is dominated by events from the `dasd` process, which seems to be involved in some kind of scoring or processing activity.
* Many of these events have similar patterns, with `Device Activity Policy` and `policyWeight` values indicating that these processes are related to device activity or policy evaluation.
* There are a few `Result Dependency Policy` events that suggest dependencies were not satisfied.

**Possible Causes:**

* Issues with the Preferences framework or files (254-257)
* Problems with the device activity or policy evaluation processes (dasd)
* Dependency issues or unsatisfied conditions (Result Dependency Policy events)

**Useful Next Checks:**

* Investigate the `cfprefsd` process to see if there are any issues with the Preferences framework or files.
* Examine the `dasd` process to understand its purpose and potential issues.
* Review system logs and configuration files to see if there are any relevant dependencies or conditions that may be causing issues.

Batch 8:
Here are the relevant events with original line numbers and timestamps:

* Device Activity Policy was evaluated (line 311) with a response of MNP (313)
* Errors occurred when trying to open a private file or directory (lines 314-319)
* A connection was established (line 320) and a UDP socket was created (lines 321-323)
* A user was retrieved and resolved (lines 325-327)
* A membership API was used (lines 327 and 330)
* A directory was updated (line 331)
* A Biome entry was evicted (line 332)
* A performance power service was used (line 333)
* A location service was used (lines 335-336)
* A wireless network was configured (lines 336-344)

Observations:

* The Device Activity Policy was evaluated and responded with MNP
* There were errors when trying to open a private file or directory
* A connection was established and a UDP socket was created
* User and membership APIs were used
* A Biome entry was evicted and a performance power service was used
* A location service was used
* A wireless network was configured

Possible causes:

* The errors when trying to open a private file or directory could be due to file system issues or permissions problems
* The evaluation of the Device Activity Policy and the response of MNP could be related to network or system configuration issues
* The use of the membership API could be related to user or group management issues
* The configuration of the wireless network could be related to network or system configuration issues

Next checks:

* Check the file system for any issues or permissions problems
* Check the Device Activity Policy and MNP response for any configuration issues
* Check the membership API usage for any user or group management issues
* Check the wireless network configuration for any issues or problems
* Check the system logs for any other relevant events or errors

Batch 9:
**Relevant Events:**

1. **Error 353-379:** Sandbox errors for CGPDFService (PIDs 28063 and 28029) related to:
	* Denying file-read-data access to various files (e.g., `/Users/[user]/Library/Preferences/.GlobalPreferences.plist`)
	* Denying mach-lookup to `com.apple.diagnosticd`
2. **XPC connection invalidation (363-365, 368):** CGPDFService's XPC message reply connection was invalidated, likely due to the client process (PID 28028) exiting or cancelling the connection.

**Possible Causes:**

1. **Sandbox issues:** CGPDFService may be violating sandbox restrictions, leading to these errors.
2. **Client process exit:** The client process (PID 28028) may have exited or cancelled the connection, causing the XPC connection to be invalidated.

**Next Checks:**

1. **Verify CGPDFService configuration:** Check the CGPDFService configuration to ensure it is properly set up and follows sandbox guidelines.
2. **Investigate client process:** Investigate the client process (PID 28028) to determine why it exited or cancelled the connection.
3. **Monitor system logs:** Monitor system logs for any additional errors or issues related to CGPDFService or the client process.

Batch 10:
Here are the relevant events with original line numbers and timestamps:

1. **Launch Services assertion invalidated** (391): The launch services daemon (launchservicesd) invalidates an assertion.
2. **Running Board update** (392): The running board daemon (runningboardd) reports the state of an application as "running-active" with the role "UserInteractiveFocal".
3. **Sandbox errors** (395-396): The kernel reports duplicate reports for the Sandbox: CGPDFService and sharingd.
4. **Bluetooth and sharing updates** (398-404): The Bluetooth daemon (bluetoothd) and sharing daemon (sharingd) report updates related to proximity pairing and clearing duplicate caches.
5. **Mail IMAP connection** (409-410): The Mail app (Mail) establishes an IMAP connection to imap.mail.me.com and reads mailbox data.
6. **Running Board assertion acquisition and invalidation** (411-422): The running board daemon (runningboardd) acquires and invalidates an assertion targeting the System Preferences app (com.apple.systempreferences).
7. **Game Policy updates** (422-424): The game policy daemon (gamepolicyd) reports updates related to process states.

Possible causes:

* Sandbox issues with CGPDFService or sharingd
* Issues with the Running Board or its assertions
* Problems with the Bluetooth or sharing daemons
* IMAP connection issues with the Mail app

Next checks:

* Verify the Sandbox configuration and permissions
* Investigate Running Board assertions and their dependencies
* Check Bluetooth and sharing daemon logs for errors or issues
* Inspect Mail app settings and IMAP connection configurations

Batch 11:
**Relevant Events**

1. **Default WindowServer[642]**: Received state update for extension `com.apple.systempreferences.GeneralSettings[config:[identifier]]` (lines 425-427)
2. **UIKitSystem[1136]**: Observed process states changed (line 426)
3. **xpcproxy[28064]**: Retrieved user by ID, resolved user group list, and translated identifier (lines 428-430)
4. **mDNSResponder[707]**: Received an IPv6 mDNS response from `<private>` (line 431)
5. **cfprefsd[645]**: Attempted to open `<private>` but failed with error "No such file or directory" (lines 434-441, 452-457, 459-464)
6. **Mail[1264]**: Read messages from IMAP connection to `<private>` (line 447)

**Separate Observations from Possible Causes**

**Observations:**

* Multiple processes (WindowServer, UIKitSystem, xpcproxy, cfprefsd) received state updates or made requests.
* cfprefsd processes repeatedly attempted to open `<private>` files but failed with error "No such file or directory".

**Possible Causes:**

* Corrupted or missing configuration files (e.g., `<private>`).
* Incorrect file permissions or ownership.
* Issues with the `cfprefsd` process or its connections.

**Next Checks:**

1. Verify the existence and integrity of the `<private>` files.
2. Check file permissions and ownership for the `<private>` files.
3. Investigate the `cfprefsd` process and its connections to identify potential issues.
4. Review system logs for further errors or warnings related to the observed events.

Batch 12:
Relevant events:

465-467: IMAP connection to imap.mail.me.com, mailbox Trash, and read status updates.

469-480: Apple's AirDrop and Wi-Fi Direct (AWDL) protocol monitoring and peer tracking.

482-491: InfraPeers database update, showing connected devices and their network statistics.

494: Apple's mDNS (multicast DNS) service peer lost event.

495-505: Various error messages from the preferences daemon (cfprefsd), likely related to file system or permissions issues.

Next checks:

1. Verify IMAP connection and mailbox configuration.
2. Check AirDrop and AWDL protocol settings and logs for any issues.
3. Investigate InfraPeers database and connected devices for any anomalies or potential issues.
4. Review mDNS service logs for any errors or issues.
5. Check preferences daemon logs and configuration for any file system or permissions issues.

Note: Since the error messages from cfprefsd seem to be related to file system or permissions issues, it's possible that the issue is not directly related to the IMAP connection or AirDrop protocol. Further investigation is required to determine the root cause of the issue.

Batch 13:
**Relevant Events:**

1. **Error**: cfprefsd (645, 978) - Couldn't open <private> due to No such file or directory (lines 506-514, 536-538)

**Observations:**

* Multiple instances of cfprefsd (645, 978) are experiencing issues opening <private> files.
* All errors have the same timestamp (17:06:55.029).
* There are no other error messages or significant events in this log section.

**Possible Causes:**

* Corrupted or missing preferences files (<private>) that cfprefsd is trying to access.
* Issues with cfprefsd itself, such as a configuration problem or a bug.

**Useful Next Checks:**

1. Check the permissions and ownership of the <private> files to ensure they are accessible by cfprefsd.
2. Verify that cfprefsd is properly configured and running correctly.
3. Search for other logs or system reports that may indicate the root cause of the issue.

If you have any further information or would like me to analyze more log sections, feel free to provide them!

Batch 14:
**Relevant Events:**

1. **lsd** and **analyticsd** processes (lines 543-544) were invalidated because the client process (pid 28047) either cancelled the connection or exited. This suggests that some process or service connected to these daemons was terminated or cancelled.
2. **Sandbox** denials (lines 549-552, 557-562) occurred for **CGPDFService** (pid 28053 and 28054) trying to access files and perform system calls. This may indicate an issue with the Sandbox or the process attempting to access restricted areas.
3. **Siri AI** failed to get a valid **IFGraphicsContextPreset** (lines 569-572), which may be related to graphics rendering issues.

**Observations:**

* The log contains multiple events related to **lsd**, **analyticsd**, and **mds** processes, which are all related to the system's metadata and analytics services.
* There are also several events related to **Sandbox** denials and **CGPDFService**, which may indicate an issue with process isolation or access control.
* **Siri AI** experienced issues with graphics rendering, which may be related to system configuration or hardware issues.

**Possible Causes:**

* Process termination or cancellation (e.g., **lsd** and **analyticsd**)
* Sandbox issues or restrictions preventing access to restricted areas (e.g., **CGPDFService**)
* Graphics rendering issues with **Siri AI**

**Next Checks:**

* Review system logs and process activity to determine the cause of the **lsd** and **analyticsd** terminations.
* Investigate Sandbox restrictions and access control lists to ensure that processes are not being restricted unnecessarily.
* Check system configuration and hardware to determine if graphics rendering issues are related to a specific device or software component.

Batch 15:
Here are the relevant events with timestamps and line numbers:

* 584: Default Siri AI[1284] failed to find named image for name:<private> (17:06:55.092)
* 591: corespotlightd[1125] started a query (17:06:55.097)
* 592: corespotlightd[1125] started an MD query (17:06:55.099)
* 593: Siri AI[1284] notified the Launch Services database (17:06:55.099)
* 595: kernel[0] reported a duplicate sandbox report for CGPDFService (17:06:55.100)
* 596: kernel[0] reported a deny(1) syscall-unix for sharingd (17:06:55.100)
* 613: Mail[1264] read a message from the Trash mailbox (17:06:55.102)

Observations:

* There are several instances of the NotifyToken::RegisterDispatch() function being called, which suggests that various processes are interacting with the Launch Services database.
* The corespotlightd process is active, suggesting that Spotlight indexing may be ongoing.
* The Siri AI process is also active, but the failure to find a named image may indicate some issue with Siri functionality.
* The kernel is reporting duplicate sandbox reports and denying certain system calls, which may indicate some security-related issues.

Possible causes:

* Issues with the Launch Services database or its interaction with other processes.
* Problems with Siri AI functionality or image loading.
* Security issues or sandboxing issues.
* Ongoing Spotlight indexing or other system processes.

Next checks:

* Investigate the Launch Services database and its interactions with other processes.
* Check for any issues with Siri AI functionality or image loading.
* Review system logs for any security-related issues or sandboxing issues.
* Monitor system processes and Spotlight indexing to ensure they are not causing any performance issues.

Batch 16:
**Relevant Events:**

1. Multiple processes (swcd, ContextStoreAgent, siriinferenced, etc.) register dispatches with the Launch Services database (lines 617-622, 624-626, 628) around the same time (17:06:55.105-106).

**Possible Causes:**

1. A system-wide event or notification triggered these processes to register their dispatches.

**Next Checks:**

1. Review the system logs around this time to see if there were any other events or notifications that may have triggered these processes.
2. Check if any of these processes were running with elevated privileges or had unusual permissions.

**Observations:**

1. Most processes registered their dispatches within a narrow time window (around 17:06:55.105-106).
2. Some processes (corespotlightd, pkd) issued sandbox extensions for sub-services (lines 629-637).
3. There were some XPC connection-related events (lines 642-645), possibly indicating that some process or service was terminated or disconnected.

Batch 17:
Relevant events:

* Line 648: The corespotlightd process resets its journal.
* Line 652: The corespotlightd process issues a query with 2 nodes.
* Line 654-662: The spotlightknowledged.updater process schedules and processes journal events.
* Line 687: The corespotlightd process finds 94 items in a query.
* Line 690: The corespotlightd process finishes building its bundle cache.

Possible causes:

* Spotlight indexing or query processing issues.
* Corespotlightd process experiencing performance issues or stalls.
* Spotlight knowledged.updater process having trouble processing journal events.

Useful next checks:

* Check the Spotlight indexing and query processing logs for any errors or issues.
* Verify that the corespotlightd process is running and not experiencing any performance issues.
* Investigate the journal events being processed by the spotlightknowledged.updater process to see if there are any patterns or issues.

Note: The log lines contain many references to private data, which may not be relevant to the issue at hand.

Batch 18:
**Relevant Events:**

1. **Error:** `cfprefsd` couldn't open `<private>` due to "No such file or directory" (692-697, 714, 717)
2. **Error:** `CGPDFService` failed to find `1' in name table dictionary (711)
3. **Error:** `kernel` denied access to `/Library/Preferences/Logging/com.apple.diagnosticd.filter.plist` and `mach-lookup com.apple.diagnosticd` for `CGPDFService` (720-723, 729-732)

**Separate Observations from Possible Causes:**

* **cfprefsd** errors: possible issue with preference files or permissions
* **CGPDFService** errors: possible issue with PDF rendering or caching
* **kernel** errors: possible issue with sandboxing or file system access

**Useful Next Checks:**

1. Verify the integrity of preference files and permissions
2. Check PDF rendering and caching settings
3. Investigate sandboxing and file system access issues
4. Review system logs for other errors or anomalies around the same time

**No clear evidence of a specific issue or culprit, but the combination of errors suggests a possible system or configuration issue. Further investigation is recommended.**

Batch 19:
**Events:**

1. `733`: CoreDuet's ClientContext objectForContextualKeyPath (17:06:55.168)
2. `734-737`: corespotlightd's flush and call flush on readOnly index (17:06:55.179)
3. `738-748`: corespotlightd's shadow and copy file operations (17:06:55.181-17:06:55.207)
4. `749-752`: corespotlightd's SDB copy file operations (17:06:55.205-17:06:55.207)
5. `753-754`: corespotlightd's shadow and unlink operations (17:06:55.209-17:06:55.220)
6. `755-756`: corespotlightd's unlink and Path operations (17:06:55.225-17:06:55.228)
7. `757-758`: corespotlightd's unlink and General operations (17:06:55.228-17:06:55.228)
8. `759`: corespotlightd's State sync complete (17:06:55.228)
9. `760`: Error: IVFVectorIndex::unlink failed (0) (17:06:55.235)
10. `761-764`: corespotlightd's CI createIndex and create vector index operations (17:06:55.237-17:06:55.246)
11. `765`: Error: IVFVectorIndex::unlink failed (0) (17:06:55.249)
12. `766`: corespotlightd's IVFVectorIndex create operation (17:06:55.249)
13. `767-769`: xpcproxy's Retrieve User and Resolve user group list operations (17:06:55.254-17:06:55.257)
14. `770-771`: accountsd's invalidated connections (17:06:55.258)
15. `772-774`: runningboardd's acquireAssertionWithDescriptor and Acquiring assertion operations (17:06:55.258)

**Observations:**

1. There are several corespotlightd-related events, including flush, shadow, and copy file operations, which may indicate Spotlight indexing or searching activities.
2. There are also several xpcproxy-related events, which may indicate user authentication or authorization activities.
3. The runningboardd-related events may indicate the launch or shutdown of an application.
4. The accountsd-related events may indicate changes to user accounts or authentication.

**Possible Causes:**

1. Spotlight indexing or searching activities may be causing the system to slow down or become unresponsive.
2. User authentication or authorization issues may be causing problems with application launches or shutdowns.
3. The runningboardd-related events may indicate that an application is not launching or shutting down properly.

**Useful Next Checks:**

1. Check the Spotlight indexing or searching activities to see if they are consuming system resources.
2. Verify user authentication or authorization settings to ensure they are correct.
3. Check the runningboardd-related events to see if they are related to a specific application or issue.
4. Check system logs for any other relevant events or errors.

Batch 20:
Here are the relevant events with original line numbers and timestamps:

**Events:**

1. **Connection invalidation**: Lines 778-783, timestamps 2026-11-01 17:06:55.258-17:06:55.259. Multiple connections are invalidated by the client process (pid 27866) or by calling `xpc_connection_cancel()`.
2. **Running Board updates**: Lines 784-786, timestamps 2026-11-01 17:06:55.260-17:06:55.261. The Running Board invalidates an assertion and updates the state of an extension.
3. **Process state changes**: Lines 787-792, timestamps 2026-11-01 17:06:55.261-17:06:55.261. Multiple processes (UIKitSystem, WindowServer, and gamepolicyd) observe process state changes.

**Possible causes:**

1. **Unintended process termination**: The client process (pid 27866) may have terminated unexpectedly, leading to the connection invalidations.
2. **Configuration issues**: The `xpc_connection_cancel()` calls may indicate intentional cancellation of connections, but the actual cause is unclear.

**Next checks:**

1. **Verify process termination**: Check if the client process (pid 27866) was terminated intentionally or unexpectedly.
2. **Check configuration files**: Investigate if any configuration files are missing or corrupted, which could lead to the `Couldn't open <private> due to No such file or directory` errors.
3. **Review system logs**: Look for any other relevant logs or errors that may have occurred around the same time.

Note: This analysis focuses on the provided log excerpt and does not invent events or repeat account names, hostnames, or internal URLs.

Batch 21:
**Relevant Events:**

1. **Cor spotlightd**: The Corespotlightd process is syncing the spotlight index, which involves copying files and updating the index (lines 814-827).
2. **Error: cfprefsd**: The cfprefsd process (configurations and preferences) is experiencing errors opening files due to "No such file or directory" errors (lines 830-835, 837, 847).
3. **Analytics and Duet**: The analyticsd and mds processes are performing various tasks, including activating connections and updating contextual key paths (lines 838-844).

**Possible Causes:**

1. **File system issues**: The errors with cfprefsd suggest potential issues with file system accessibility or corrupted files.
2. **Cor spotlightd**: The spotlight index syncing process may be experiencing issues or taking longer than expected to complete.

**Next Checks:**

1. **Verify file system integrity**: Check the file system for any issues, such as corrupted files or permissions problems.
2. **Monitor Corespotlightd**: Observe the Corespotlightd process to see if it's experiencing any issues or taking an abnormally long time to complete its tasks.
3. **Analyze analytics and Duet**: Review the analytics and Duet processes to ensure they're functioning correctly and not experiencing any issues.

Batch 22:
Here are the relevant events with original line numbers and timestamps:

* Multiple processes (Default WallpaperAgent, Default System Settings, Default sharingd, and Default chronod) are performing CFURLResolveBookmarkData operations, which suggests that these processes are interacting with bookmarked URLs. (Lines 856-920)

Possible causes:

* Bookmarked URLs are being accessed or updated by these processes.
* Some processes may be trying to resolve bookmarked URLs or update their bookmarks.

Useful next checks:

* Investigate the processes' activities further to determine what they are doing with these bookmarked URLs.
* Check the system's bookmarks to see if any changes have been made recently.
* Verify that the processes' permissions and configurations are correct.

Note: Since all the events are related to CFURLResolveBookmarkData operations, it appears that this event is the main focus of the log.

Batch 23:
**Relevant Events:**

* Lines 933-934: kernel process (wlan0) checks traffic counters.
* Lines 923-929, 935-952, 954-957, 959-965, 969-974, 977-984: Various system processes (WallpaperAgent, chronod, sharingd, System Settings, com.apple.quicklook.ThumbnailsAgent) resolve bookmark data using CFURLResolveBookmarkData.

**Separate Observations from Possible Causes:**

* The kernel process is checking traffic counters, which could be related to network activity or performance.
* The system processes are resolving bookmark data, which might be related to file system operations or app behavior.

**Next Checks:**

* Investigate kernel process and traffic counter information to determine the cause of the traffic counter checks.
* Monitor file system operations and app behavior to determine the purpose of the bookmark data resolution.
* Check for any unusual or unexpected system behavior or network activity.

**Note:** The log lines are mostly identical, indicating a repetitive pattern of CFURLResolveBookmarkData events. This might be a normal system behavior or a sign of an issue. Further investigation is needed to determine the root cause.

Batch 24:
Relevant events:

* 992-1014: Multiple processes (Default sharingd, Default chronod, and Default System Settings) are performing CFURLResolveBookmarkData operations around the same time (2026-11-01 17:06:55).
* 1011: The com.apple.quicklook.ThumbnailsAgent process is also performing CFURLResolveBookmarkData operations around the same time.
* 1025, 1055: The com.apple.quicklook.ThumbnailsAgent process is again performing CFURLResolveBookmarkData operations.

Separate observations from possible causes:

* Observations:
	+ Multiple processes are performing CFURLResolveBookmarkData operations around the same time.
	+ The com.apple.quicklook.ThumbnailsAgent process is performing CFURLResolveBookmarkData operations multiple times.
* Possible causes:
	+ A system-wide or application-specific bookmarking operation is being performed.
	+ The com.apple.quicklook.ThumbnailsAgent process is performing thumbnail generation for multiple files or folders.
	+ A system-level or application-level indexing or cataloging operation is being performed.

Useful next checks:

* Check the system logs for any related errors or warnings around the same time.
* Check the system's bookmarking or indexing settings to see if any recent changes were made.
* Check the com.apple.quicklook.ThumbnailsAgent process's activity to see if it's related to thumbnail generation or other operations.
* Check the system's disk usage and free space to see if there are any issues with disk space or memory.

Batch 25:
**Relevant Events:**

* Lines 1083, 1084, and 1085: The sharingd process is resolving bookmark data.
* Line 1093: The System Settings process is resolving bookmark data.
* Line 1103: The chronod process encounters an error while trying to run in the App Sandbox. The error is that the extension is not entitled to run in the App Sandbox.

**Possible Causes:**

* The chronod process is having issues with its App Sandbox entitlement, which could be due to a misconfigured extension or a bug in the extension framework.
* The sharingd and System Settings processes may be experiencing issues with resolving bookmark data, which could be due to a configuration issue or a bug in the relevant framework.

**Useful Next Checks:**

* Check the App Sandbox entitlement of the chronod process and its extensions to ensure they are properly configured.
* Investigate the sharingd and System Settings processes to determine if they are experiencing any issues with resolving bookmark data.
* Check for any recent changes to the system configuration or the applications involved that could have caused these issues.

Batch 26:
**Relevant Events:**

* Lines 1115-1134: Multiple instances of `CFURLResolveBookmarkData` from `com.apple.quicklook.ThumbnailsAgent` and other processes (e.g., `System Settings`, `chronod`, and `sharingd`) around the same timestamp (2026-11-01 17:06:55).
* Lines 1145-1164: Similar CFURLResolveBookmarkData events from the same processes as above.

**Observations:**

* The events are all related to the `CFURLResolveBookmarkData` function, which suggests that the system is resolving or manipulating bookmarks (e.g., URLs or file paths) for various processes.
* The timestamps are all within a very short time frame (less than 1 second), indicating a high level of activity in a short period.

**Possible Causes:**

* Bookmarks or URL manipulation in various processes (e.g., QuickLook, System Settings, chronod, and sharingd) around the same time.
* System-wide bookmark or URL resolution activity, possibly triggered by a specific event or action.

**Next Checks:**

* Review the system's bookmark or URL resolution logs to see if there were any specific events or actions that triggered this activity.
* Investigate the processes involved (e.g., `com.apple.quicklook.ThumbnailsAgent`, `System Settings`, `chronod`, and `sharingd`) to determine what they were doing during this time frame.
* Check for any system or process errors around this time frame that could be related to the bookmark or URL resolution activity.

Batch 27:
Relevant events:

* Multiple instances of `CFURLResolveBookmarkData` events (lines 1173-1208, 1215-1229) suggest that the system is resolving bookmark URLs. This may be related to the QuickLook thumbnails agent or other system processes.
* `observedProcessStatesDidChange` event (line 1183) indicates that the game policy daemon (gamepolicyd) has received an update about the state of a process.
* `Received state update for 27866` (line 1185) suggests that the Family-Settings extension is running in an active, not visible state.

Possible causes:

* System processes may be experiencing issues with bookmark resolution or other system-level operations.
* The Family-Settings extension may be causing issues or being impacted by system-level changes.

Next checks:

* Verify if any system processes or extensions are experiencing issues or errors.
* Check if any bookmark-related issues are present in the system logs or other logging mechanisms.
* Investigate if the Family-Settings extension is causing any issues or conflicts with other system processes.

Note: The majority of the log entries appear to be related to URL resolution and connection events, which may be normal system activity. The events mentioned above are the most relevant and potentially indicative of issues or anomalies.

Batch 28:
Here are the relevant events with original line numbers and timestamps:

* Connection setup and teardown:
	+ 1236: Connection cancelled
	+ 1240: Connection cancelled
	+ 1241: Connection cancelled
	+ 1256: Connection cancelled
	+ 1258: Connection done
	+ 1265: Connection done
* Network statistics:
	+ 1233: Init: 1, Conn_Time: 28.704ms, SYNs: 1, ...
	+ 1245: Duration: 30.442s, DNS @0.000s took 0.001s, ...
	+ 1251: rtt_cache: kernel, rtt_upd: 4, rtt: 10.062ms, ...
* TCP output:
	+ 1260: tcp_output [C1.1.1:3] flags=[F.] seq=2358653623, ack=3299032314, ...
	+ 1266: tcp_output [C2.1.1:3] flags=[F.] seq=1769483869, ack=3035939473, ...

Separate observations and possible causes:

* The connection was cancelled multiple times (1236, 1240, 1241, 1256, 1265). This might be due to a network or system issue.
* The connection was established and then cancelled, only to be re-established and then cancelled again (1233-1235, 1240-1241, 1256-1258). This could indicate a problem with the network or the system's network handling.
* The rtt (round-trip time) and rtt_var (round-trip time variance) values are relatively high (10.062ms and 5.562ms, respectively). This might indicate network congestion or packet loss.

Next checks:

* Check the system's network configuration and settings to see if there are any issues that could be causing the connection to be cancelled.
* Verify that the system's network interface is functioning correctly.
* Check the network logs for any errors or issues that might be related to the connection being cancelled.
* Run a network diagnostic tool (e.g. `netstat` or `tcpdump`) to see if there are any issues with the network connection.

Batch 29:
Relevant events:

* 1288-1356: Multiple instances of `CFURLResolveBookmarkData` from processes `chronod` and `sharingd`, as well as `com.apple.quicklook.ThumbnailsAgent`. These events all occur within a 1-second time frame.

Observations:

* The majority of these events are from the `chronod` and `sharingd` processes, which suggests that these processes are involved in resolving bookmark data.
* The `com.apple.quicklook.ThumbnailsAgent` process also appears to be involved in resolving bookmark data, potentially as part of a thumbnailing or previewing activity.
* All of these events occur within a short time frame, which may indicate a specific system or application activity that is causing these events to occur.

Possible causes:

* A system or application is actively resolving bookmark data, potentially as part of a file management or previewing activity.
* A specific system or application is experiencing performance issues or errors, leading to repeated attempts to resolve bookmark data.

Useful next checks:

* Investigate system and application logs for related errors or issues.
* Check for any system or application configuration files that may be related to bookmark data resolution.
* Review system and application activity to determine if there are any specific processes or activities that are causing these events to occur.
* Check for any system or application performance issues that may be related to these events.

Batch 30:
**Relevant Events:**

1. **CFURLResolveBookmarkData**: This event is repeated multiple times (1357-1374) with the same timestamp (2026-11-01 17:06:55.403). This suggests that there may be an issue with bookmark data resolution.
2. **Sandbox denial**: There are two instances of Sandbox denial (1391 and 1406) related to mach-lookup of com.apple.diagnosticd. This may indicate a potential security issue.
3. **Kernel events**: There are several kernel-related events (1393-1399, 1402-1405) that seem unrelated to each other. These may be normal system activity or potentially indicative of an issue.

**Possible Causes:**

1. **Bookmark data resolution issue**: The repeated CFURLResolveBookmarkData events may be causing issues with file or folder access.
2. **Sandboxing issue**: The Sandbox denial events may indicate a security issue, potentially caused by a malicious app or a configuration problem.
3. **Kernel activity**: The kernel events may be related to normal system activity or a specific issue, such as a network problem or a driver issue.

**Useful Next Checks:**

1. **Verify bookmark data resolution**: Check if the bookmark data resolution issue is specific to a particular app or folder.
2. **Investigate Sandboxing issue**: Check the system logs for any other related errors or warnings, and investigate the com.apple.diagnosticd process.
3. **Analyze kernel activity**: Check the system logs for any other related kernel events or errors, and investigate the kernel activity to determine its cause.

Batch 31:
**Relevant Events:**

* Lines 1412-1414: `fskit_agent` processes CFURLResolveBookmarkData, which may be related to file system or URL handling.
* Lines 1422-1438: `com.apple.CMExtensionBroker` and `cfprefsd` processes experience issues opening files or directories, resulting in "No such file or directory" errors.
* Line 1448: `FamilySettings` processes a TCP receive background (recv_bg) configuration change.

**Separate Observations from Possible Causes:**

* The repeated `CoreDuet: ClientContext objectForContextualKeyPath` messages (lines 1408-1415, 1420-1429, 1431-1435, 1439-1447) may indicate a loop or recursion in the system's contextual key path handling.
* The `com.apple.CMExtensionBroker` and `cfprefsd` processes experiencing issues opening files or directories might be related to a file system or directory issue.
* The `FamilySettings` process configuration change might be related to network or TCP settings.

**Useful Next Checks:**

* Verify file system integrity and check for any issues with file or directory access.
* Investigate the `com.apple.CMExtensionBroker` and `cfprefsd` processes to determine the root cause of the file or directory issues.
* Check the system's contextual key path handling and potential loop or recursion issues.
* Review network and TCP settings to confirm the `FamilySettings` process configuration change is not causing issues.

Batch 32:
The part of the macOS unified-log export you provided contains a large number of log messages from the `mds` process, which is the metadata storage process. The messages are all related to the `CoreDuet` module, which is responsible for managing the metadata cache.

Here are the relevant events:

* Line 1454: The `com.apple.CMExtensionBroker` process is unable to find an app extension record for an item at a private location.
* Line 1464-1504: The `mds` process is repeatedly calling the `ClientContext objectForContextualKeyPath` method.

Possible causes:

* The `com.apple.CMExtensionBroker` process may be experiencing issues with finding app extension records due to corrupted or missing data.
* The repeated calls to the `ClientContext objectForContextualKeyPath` method in the `mds` process may be related to issues with metadata caching or indexing.

Useful next checks:

* Check the system logs for any other errors or warnings around the time of the `com.apple.CMExtensionBroker` process issues.
* Use the `mdsutil` tool to inspect the metadata cache and see if there are any issues with the cache itself.
* Check the system for any software updates or patches that may be related to the `CoreDuet` module or metadata caching.

Batch 33:
Here are the relevant events with original line numbers and timestamps:

**WLAN and AppleIDSettings**

* 1506: wlan0: com.apple.p2p.awdl0: programChipWithNewMaster: Programming new Mst: A6:5C:DC:E1:65:AD at 6682.266ms HC 1 met 529 my met 510
* 1510: wlan0: com.apple.p2p.en1: set Datapath Open needsTrigger 0
* 1518: accountsd[1044] invalidated because the client process (pid 27865) either cancelled the connection or exited
* 1520: runningboardd[651] acquireAssertionWithDescriptor
* 1528-1529: AppleIDSettings[27865] invalidated because the current process cancelled the connection by calling xpc_connection_cancel()

**Running Board and State Updates**

* 1521: runningboardd[651] acquireAssertionWithDescriptor
* 1526: runningboardd[651] Assertion 651-27865-8874 will be created as active
* 1527: runningboardd[651] state update
* 1534: WindowServer[642] observedProcessStatesDidChange
* 1533: runningboardd[651] invalidateAssertionWithIdentifier
* 1534-1535: UIKitSystem[1136] observedProcessStatesDidChange

**XPC Proxy and User Resolution**

* 1511: mds[598] ClientContext objectForContextualKeyPath:
* 1515-1543: xpcproxy[28068/28069] Retrieve User by ID, Resolve user group list, Membership API: translate identifier

**Possible Causes and Next Checks**

* The combination of WLAN and AppleIDSettings events suggests that some AppleIDSettings-related process (pid 27865) is starting or shutting down.
* The Running Board events indicate that the process is acquiring and invalidating assertions, possibly related to the AppleIDSettings process.
* The XPC Proxy events suggest that the process is resolving users and groups.
* To further investigate, I would check the AppleIDSettings and Running Board logs around the same time to see if there are any other relevant events or errors. I would also check the system logs for any other related events or issues.

Batch 34:
**Relevant Events:**

1. **1543-1549**: Default events for `cfprefsd` processes (978 and 645) activating connections with `com.apple.xpc:connection` framework.
2. **1544-1559**: Error events for `cfprefsd` processes (978 and 645) trying to open `<private>` files, resulting in "No such file or directory" errors.
3. **1560-1568**: Error events for `cfprefsd` processes (978 and 645) trying to open `<private>` files, resulting in "No such file or directory" errors.
4. **1564**: Default event for `lsd` process (999) activating a connection with `com.apple.xpc:connection` framework.

**Possible Causes:**

1. File system issues (e.g., file not found, permissions problems).
2. `cfprefsd` process errors (e.g., corrupted preferences, invalid data).
3. `lsd` process issues (e.g., unable to access file system, configuration problems).

**Next Checks:**

1. Verify file system integrity and check for any corrupted or missing files.
2. Inspect `cfprefsd` process logs and configuration files for errors or inconsistencies.
3. Investigate `lsd` process logs and configuration files for errors or inconsistencies.
4. Check system logs for any other relevant errors or warnings around the same time.
Ollama kept the analysis on my Mac, but local does not mean accurate. I still have to compare the report with the source rows and decide which events belong to the incident I am investigating.
Why I’d recommend Logger Utility
I still use Activity Monitor when a Mac feels slow and I want to see which process is using CPU or memory. When a device fails enrollment, I open Logger Utility. I can follow one process through its messages and click into the details without rebuilding a log show command every time I change the filter.
I’d recommend Logger Utility to Mac admins who spend too much time turning one log show command into the next. A failure rarely becomes clear on the first query. I need to change the filter, inspect neighboring messages, and sometimes catch a second attempt. Logger Utility puts those steps in one window and lets me export the rows I can use in a support ticket. When I ask AI for help interpreting them, I still have the original messages in front of me to check its answer.
Sources
- Logger Utility repository, README, and screenshots
- Logger Utility releases
- Logger Utility v1.5.3 private-logging profile release
- Apple unified logging documentation
- Apple log privacy options
- Apple Activity Monitor guide
- Ollama macOS quickstart
- Ollama Llama 3 model tags
- Ollama generate API
AI Usage Transparency Report
AI Era · Written during widespread use of AI tools
AI Signal Composition
Score: 0.38 · Moderate AI Influence
Summary
Logger Utility is a macOS app that helps users analyze and troubleshoot system logs. It provides a visual filter, live stream, and row inspector, making it easier to find relevant messages and understand system behavior. The app also supports integration with AI tools, allowing users to ask questions about specific log entries and receive answers in real-time.
Related Posts

When Chromium Mistakes Your VPN for a Local Network
Turning off Jamf Trust fixed the webinar, which normally would have sent me straight to its routing policies. This time the route was fine: Chromium was treating Jamf's ZTNA broker addresses as a local network, and an Edge and Chrome preference corrected it.

Amnesia Stealer Shows the Next Stage of ClickFix on macOS
Amnesia Stealer shows how ClickFix-style social engineering is adapting on macOS, while a public malware sample gives defenders an opportunity to study the behavior behind the campaign.
Apple Software Updates Need a Blueprint Before the MDM Commands Fade
Apple software update management is moving away from command-first MDM workflows. Jamf Blueprints and Declarative Device Management give Mac admins a better place to express update intent, scope, enforcement, and visibility.

Contour Brings Schema Checks to Mac Admin Configuration Work
Contour is a MacAdmins configuration toolkit that brings schema validation, repeatable generation, normalization, and AI-agent-safe command discovery to Apple configuration profiles, DDM declarations, PPPC, Santa, mSCP, Background Task Management, notifications, support app profiles, and osquery schema lookup.

Three Mac Update Helpers That Fit Below a Patch Platform
Latest, Applite, and an all-in-one macOS update script each solve a different part of lightweight Mac maintenance: app update visibility, Homebrew-backed app management, and command-line package updates that can be wrapped carefully for small teams or basic MDM.
Natural Makes the macOS Scroll Direction Toggle Less Buried
Natural is a small macOS menu bar utility that makes the natural scrolling toggle easy to reach, but building it from source also shows why open-source desktop utilities need clear prerequisite checks before they become recommended tools.

Why Mac Performance Monitor Belongs in the Mac Admin Toolbox
Mac Performance Monitor belongs in the Mac admin toolbox because it records local performance history, helps Help Desk review slow-Mac reports after the moment has passed, and keeps process telemetry on the Mac instead of sending it to a cloud service.

Jamf Moves Platform SSO Into the Enrollment Gate
Jamf's attended Simplified Setup for Platform SSO changes Mac enrollment by making identity registration part of Setup Assistant before the MDM profile is installed.

ClickLock Shows Why Terminal Paste Is a Mac Security Boundary
ClickLock Stealer shows why Mac security teams should watch for Terminal paste lures, fake AppleScript password prompts, command-line Keychain access, LaunchAgent persistence, and Jamf Protect alerts that can route suspected Macs into Jamf Pro response groups.

Deploying DDM OS Reminder 4.0.0 in Jamf
DDM OS Reminder 4.0.0 is deployed as two separate pieces in Jamf: a managed preferences profile and a one-time installer script that creates the reminder script, starter script, and LaunchDaemon heartbeat on the Mac.
