

Most slow-Mac tickets arrive late. The user already rebooted. The video call already ended. The fan noise stopped. The app that was beachballing is no longer beachballing. By the time Help Desk connects, Activity Monitor may show a perfectly normal system, which makes the ticket hard to prove and even harder to route.
Mac Performance Monitor is built for that gap. It is a native macOS utility for Apple silicon Macs that lives in the menu bar, watches CPU, memory pressure, GPU, disk, network, battery, and per-process behavior, and records history to a local SQLite database. The GitHub project describes continuous local logging, process history, pressure events, leak indicators, and on-device diagnostics without telemetry.
The useful part is simple: there is still something to inspect after the user says, “It was slow earlier.”
A performance history in the menu bar
Mac Performance Monitor is a free, open-source menu bar utility for modern Apple silicon Macs. The project requires macOS 15 Sequoia or later, runs natively, and is released under the MIT License. The downloadable package is described as Developer ID signed and notarized, with updates handled through Sparkle, while the source remains available for review and local builds.
The live readouts are useful, but the local record behind them is the reason to install it. The menu can show current memory pressure, CPU, GPU, battery, disk, network, and process data, while the history lets an admin return to the time when the problem occurred.
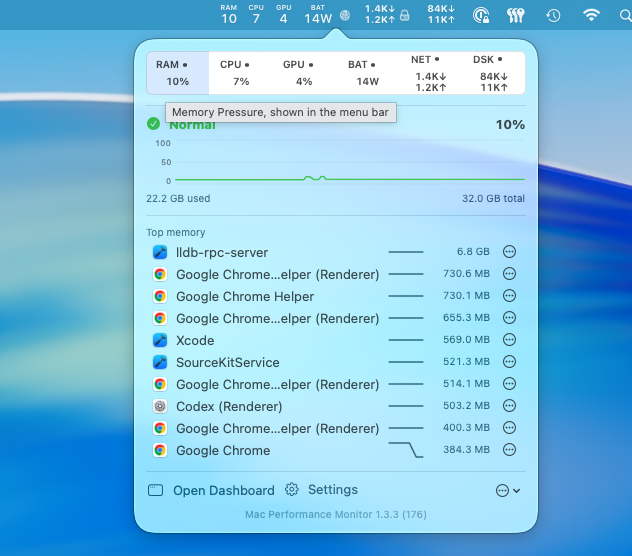
The memory view puts pressure, total memory use, and the largest consumers in one place. The CPU view does the same for load, performance and efficiency cores, and the busiest processes.
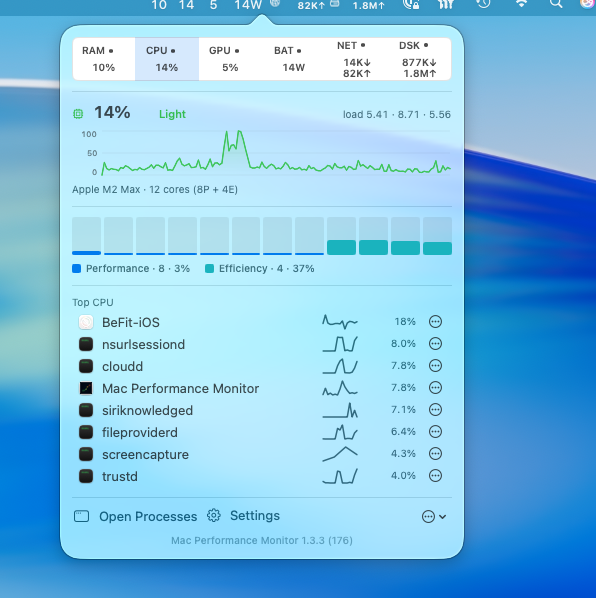
The product site calls out several features that matter operationally:
- Optional menu bar readouts for memory, CPU, GPU, battery, and network.
- Process explorer with memory footprint, CPU, threads, file descriptors, disk I/O, Rosetta status, and process history.
- Local history for memory, CPU, file descriptors, and disk I/O.
- Process groups for related apps and helpers.
- Pressure events and leak indicators.
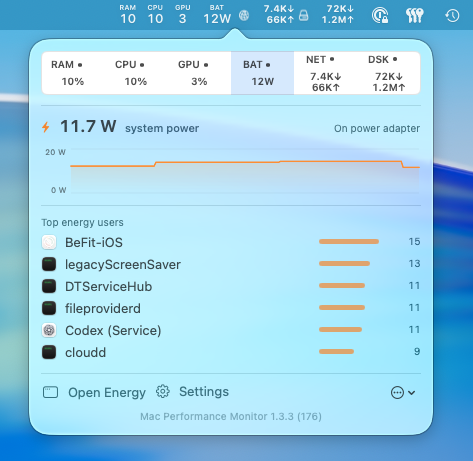
- Battery health, live power draw, discharge curve, and top energy-using processes.
- Per-app network attribution when enabled.
- Code-signing inspection for running processes.
- Size caps for the local database, plus the option to turn recording off.
This is not another Activity Monitor replacement. It is a lightweight local flight recorder for Mac performance.
Installing it
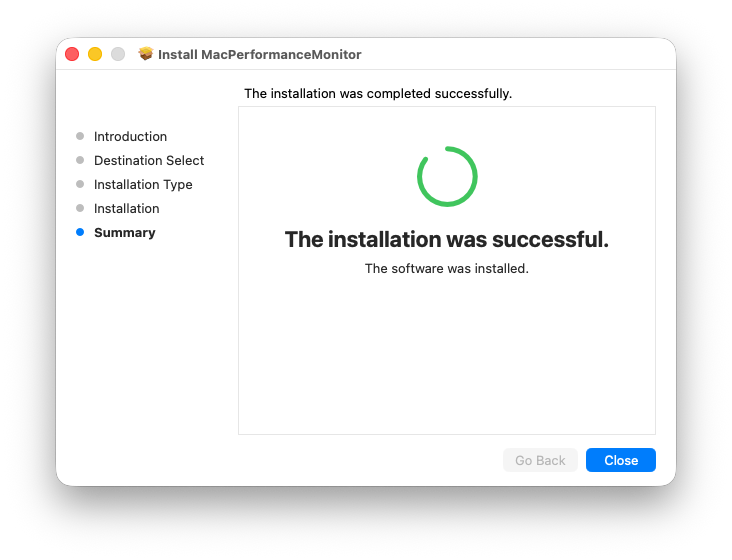
For an individual Mac, the deployment path is simple: download MacPerformanceMonitor.pkg from the project’s GitHub Releases page and install it. Before using it in a managed environment, I would still verify the package and application the same way I would review any open-source admin tool.
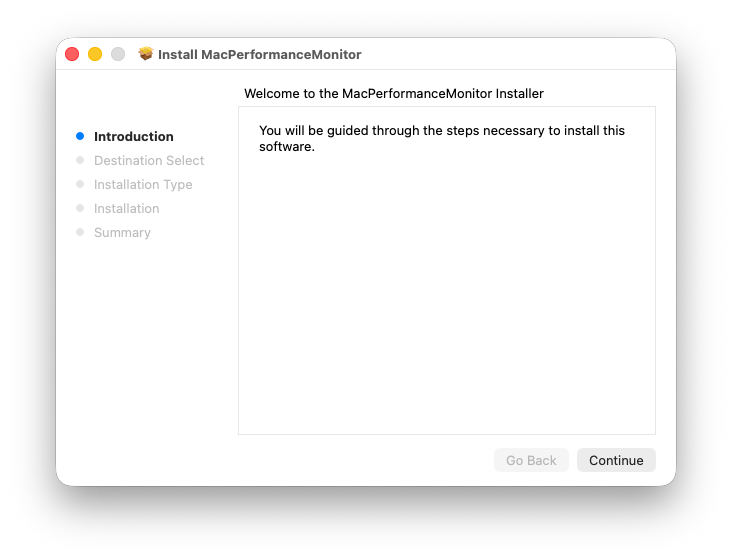
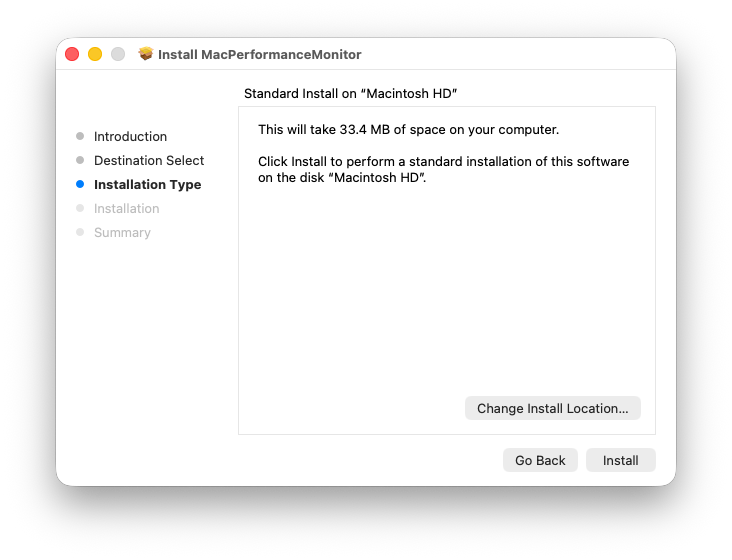
The installer is a standard macOS package and reports a 33.4 MB installed size.
pkgutil --check-signature /path/to/MacPerformanceMonitor.pkg
spctl --assess --type install --verbose=4 /path/to/MacPerformanceMonitor.pkg
After installation, verify the application bundle:
spctl --assess --verbose=4 /Applications/MacPerformanceMonitor.app
codesign -dv --verbose=4 /Applications/MacPerformanceMonitor.app
For source review or a developer test machine, the repository supports a Swift build path:
git clone https://github.com/Zesty0wl/mac-performance-monitor.git
cd mac-performance-monitor
swift build
swift test
Scripts/run.sh
For Jamf or another MDM, I would start with a controlled Self Service deployment instead of a silent fleet-wide install. The first policy would target Help Desk, Mac admins, and a small group of users who routinely report intermittent performance issues.
In Jamf, the policy shape is straightforward:
- Upload the signed
MacPerformanceMonitor.pkg. - Create a policy named
Install Mac Performance Monitor. - Add the package with the action set to install.
- Scope it to a pilot Smart Group such as
IT - Mac Performance Monitor Pilot. - Make it available in Self Service first.
- Add a short Self Service description explaining that the tool records local performance history on the Mac.
- After install, run inventory so the app presence is visible in Jamf Pro.
Help Desk installs it when a ticket needs history, power users can install it from Self Service, and admins can add it temporarily for preview software, executive support, developer troubleshooting, or machines with repeated performance complaints.
Where the history earns its keep
A familiar example is the “slow during Zoom” ticket. The Mac became unusable during a video call, but the call is over by the time Help Desk connects and Activity Monitor looks normal. With Mac Performance Monitor running, support can review that window for memory pressure, CPU spikes, network throughput, battery state, GPU use, and the process that changed first. If the culprit is a browser tab, conferencing helper, sync tool, or security agent, the timeline gives the technician evidence to work from.
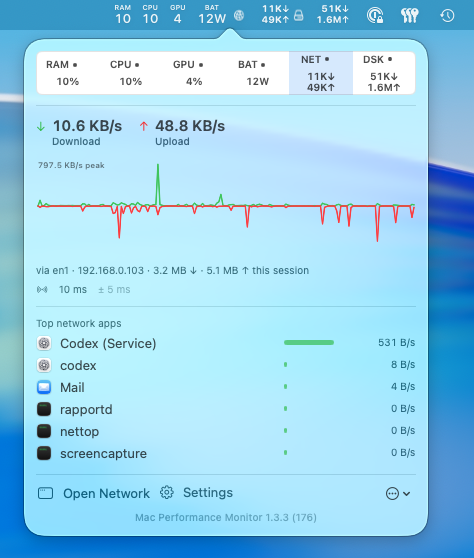
Intermittent performance problems can be difficult to diagnose because they rarely appear all at once. A process may gradually consume more memory, accumulate file descriptors, drain the battery after sleep, or behave normally for an hour before becoming unstable. A local process history makes these changes easier to spot by showing exactly when resource usage began to climb.
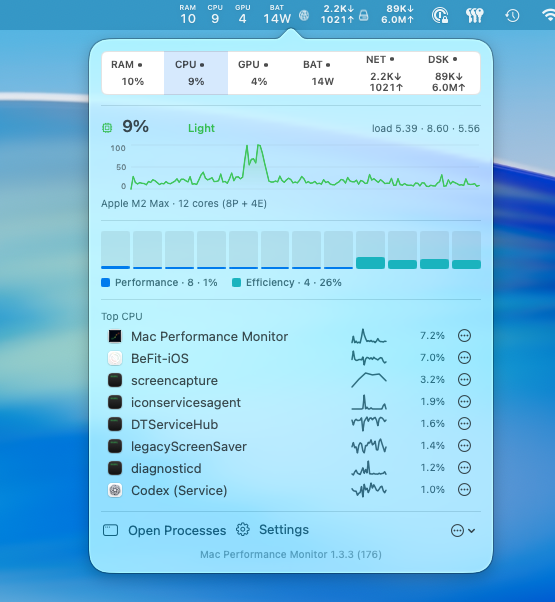
Another practical use is Help Desk escalation. Instead of forwarding a ticket that simply says the Mac is slow, a technician can ask the user to reproduce the issue and capture the relevant process history. This gives engineering, security, or infrastructure teams useful evidence to investigate.
Background agents are another common source of memory pressure. Managed Macs often run endpoint security tools, sync clients, browser helpers, conferencing software, updaters, VPN clients, and MDM services. When memory pressure increases or swap usage grows throughout the morning, process history can reveal which application or service began consuming additional resources first.
Battery drain is easier to investigate when power draw and the top energy users are visible together. If a MacBook that used to last most of the day is now empty by lunch, the timeline can show whether the drain began with a specific app, network condition, or background process.
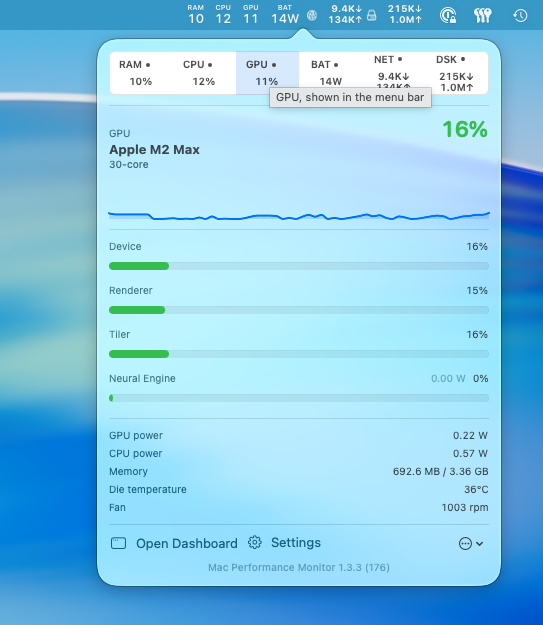
GPU activity gets its own history and breakdown, including device, renderer, tiler, Neural Engine, power, memory, temperature, and fan speed.
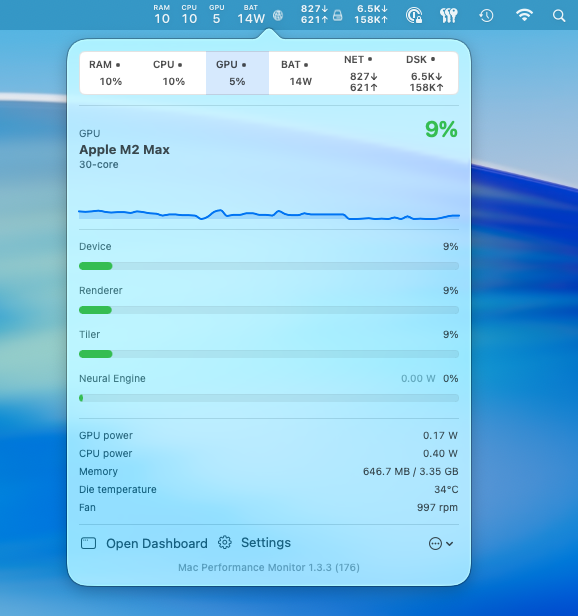
The same GPU panel remains readable in the smaller menu-bar view, so a quick check does not require opening the full dashboard.
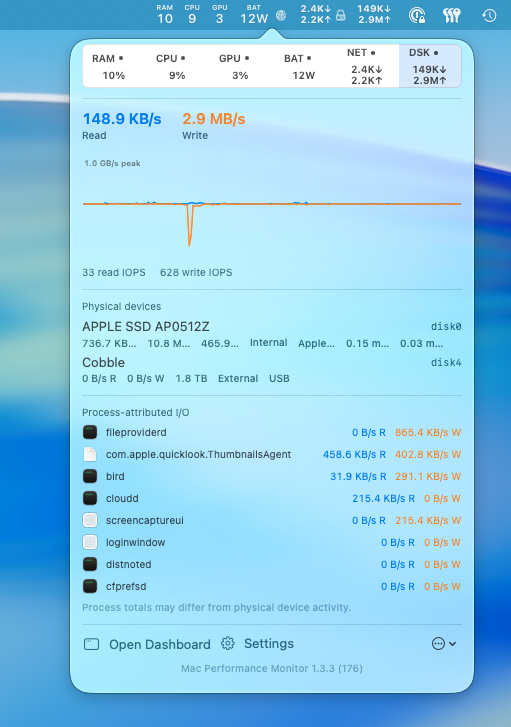
Disk activity is also attributed to processes, which helps separate an application writing heavily from the device-level symptom. File descriptor growth may be less dramatic, but it can make apps unreliable over time. Process history helps identify which process deserves deeper investigation with lsof, vendor support, or developer profiling.
A Help Desk workflow that produces evidence
I would make the Help Desk workflow explicit so the tool does not become another utility people install and forget.
For an intermittent performance ticket:
- Install Mac Performance Monitor from Self Service.
- Ask the user to keep working normally until the issue happens again.
- Record the approximate time of the slowdown, meeting, battery drain, or beachball.
- Review the Mac Performance Monitor history for that window.
- Check memory pressure, swap, CPU, disk I/O, network, battery draw, file descriptors, and process growth.
- Capture the relevant chart or process details.
- If one app or helper stands out, update the ticket with the process name, time window, metric, and observed trend.
- Escalate with evidence instead of only a user description.
That turns a vague ticket into something actionable:
User reported slowdown from 10:05-10:25.
Memory pressure increased from normal to warning.
Swap grew steadily during the call.
Process history shows Example Helper grew from 650 MB to 4.2 GB.
Disk writes also increased during the same window.
Next step: update or remove Example Helper, then repeat the same workload.
For a developer or preview-software workflow, I would use a baseline comparison:
- Reboot the Mac.
- Start Mac Performance Monitor.
- Capture 10 to 15 minutes of idle baseline.
- Run the stable build through the normal workload.
- Reboot and repeat with the preview build.
- Compare memory footprint, file descriptors, disk I/O, CPU, GPU, and pressure events.
- Use Instruments only after the timeline identifies the process worth profiling.
Mac Performance Monitor should not replace Instruments. It should help identify the process worth profiling before someone spends time in Instruments.
Use it when you need history
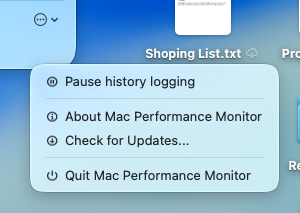
Mac Performance Monitor keeps its data in a local SQLite database and does not require an account or send telemetry to a vendor. Recording can be paused, turned off, or limited by database size. That makes it practical to install for a specific investigation and stop recording when the work is finished.
The history can include process names, app activity, network attribution, and other details about how the Mac was being used. Support should review screenshots or exports with the same care as any other diagnostic data, but this does not need to become a large policy exercise for a targeted troubleshooting tool.
Sources
- Mac Performance Monitor website
- Mac Performance Monitor GitHub repository
- Mac Performance Monitor GitHub releases
- Apple Support: View information about Mac processes in Activity Monitor
- Apple Developer: Profiling apps using Instruments
- Apple Developer: Gathering information about memory use
- Apple Developer: Finding Memory Leaks
- Microsoft Learn: Process Monitor
AI Usage Transparency Report
AI Era · Written during widespread use of AI tools
AI Signal Composition
Score: 0.28 · Moderate AI Influence
Summary
Mac Performance Monitor is a lightweight local flight recorder for Mac performance, providing process history and resource usage data to help diagnose intermittent issues.
Related Posts

When Chromium Mistakes Your VPN for a Local Network
Turning off Jamf Trust fixed the webinar, which normally would have sent me straight to its routing policies. This time the route was fine: Chromium was treating Jamf's ZTNA broker addresses as a local network, and an Edge and Chrome preference corrected it.

Amnesia Stealer Shows the Next Stage of ClickFix on macOS
Amnesia Stealer shows how ClickFix-style social engineering is adapting on macOS, while a public malware sample gives defenders an opportunity to study the behavior behind the campaign.
Apple Software Updates Need a Blueprint Before the MDM Commands Fade
Apple software update management is moving away from command-first MDM workflows. Jamf Blueprints and Declarative Device Management give Mac admins a better place to express update intent, scope, enforcement, and visibility.

Contour Brings Schema Checks to Mac Admin Configuration Work
Contour is a MacAdmins configuration toolkit that brings schema validation, repeatable generation, normalization, and AI-agent-safe command discovery to Apple configuration profiles, DDM declarations, PPPC, Santa, mSCP, Background Task Management, notifications, support app profiles, and osquery schema lookup.

Three Mac Update Helpers That Fit Below a Patch Platform
Latest, Applite, and an all-in-one macOS update script each solve a different part of lightweight Mac maintenance: app update visibility, Homebrew-backed app management, and command-line package updates that can be wrapped carefully for small teams or basic MDM.
Natural Makes the macOS Scroll Direction Toggle Less Buried
Natural is a small macOS menu bar utility that makes the natural scrolling toggle easy to reach, but building it from source also shows why open-source desktop utilities need clear prerequisite checks before they become recommended tools.

Jamf Moves Platform SSO Into the Enrollment Gate
Jamf's attended Simplified Setup for Platform SSO changes Mac enrollment by making identity registration part of Setup Assistant before the MDM profile is installed.
ClickLock Shows Why Terminal Paste Is a Mac Security Boundary
ClickLock Stealer shows why Mac security teams should watch for Terminal paste lures, fake AppleScript password prompts, command-line Keychain access, LaunchAgent persistence, and Jamf Protect alerts that can route suspected Macs into Jamf Pro response groups.
Deploying DDM OS Reminder 4.0.0 in Jamf
DDM OS Reminder 4.0.0 is deployed as two separate pieces in Jamf: a managed preferences profile and a one-time installer script that creates the reminder script, starter script, and LaunchDaemon heartbeat on the Mac.
Using Mac Health Check 4.0.0 for Self-Service Compliance and Reporting
Mac Health Check 4.0.0 gives MDM administrators a Self Service workflow for showing managed Mac health, generating local JSON, and optionally feeding Splunk reporting.