Using Mac Health Check 4.0.0 for Self-Service Compliance and Reporting
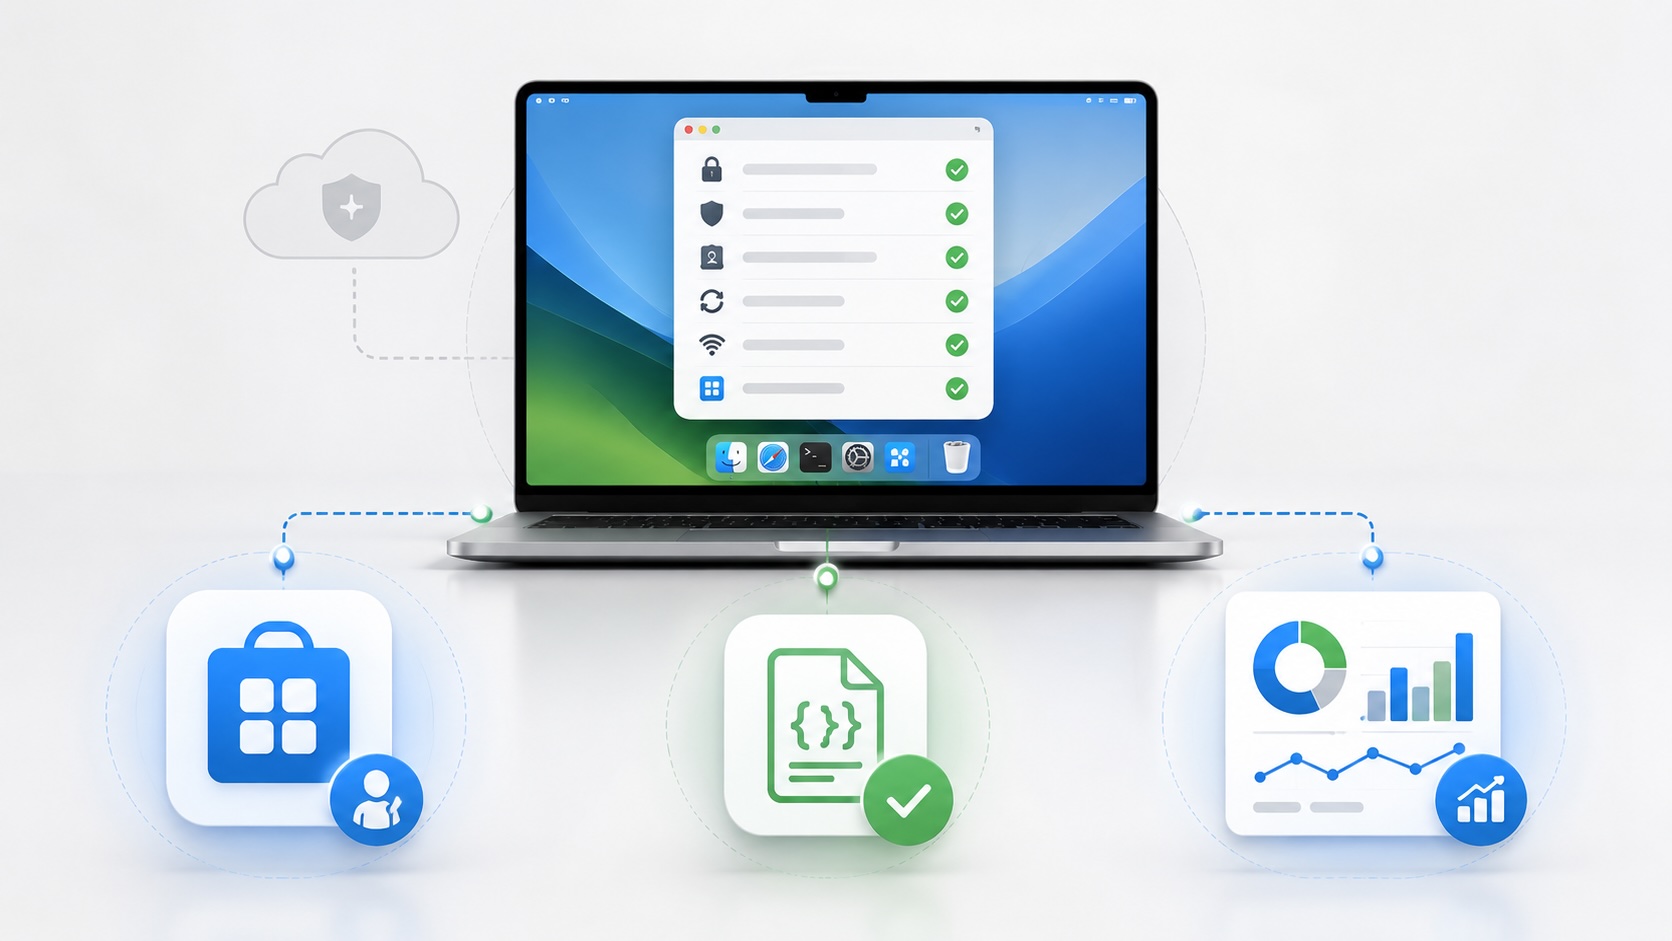

Mac Health Check 4.0.0 is for MDM administrators who need a managed way to answer a simple question: is this Mac actually healthy right now?
That question comes up constantly. A user says the Mac is slow, VPN is broken, Self Service is not working, updates are stuck, or a security tool is missing. The MDM record may say the Mac is enrolled. A compliance dashboard may say the control exists. But support still needs to know what the Mac sees locally: whether it can reach the network, whether it can run policy, whether FileVault is healthy, whether updates are staged or deferred, whether required apps are present, and whether the local state matches the management story.
Mac Health Check 4.0.0 exists for that purpose. It turns local managed-Mac health into a repeatable workflow deployed through Jamf or another MDM. The user can launch it from Self Service when support asks for it, the admin can run it silently when reporting matters, and the same result can become local evidence, JSON, or a Splunk event.
The mechanics are simple. The GitHub project runs local checks with a script, presents the result through swiftDialog, and in version 4.0.0 can generate client-side JSON using swiftDialog Inspect Mode features. The purpose is not generic monitoring. The purpose is to let an MDM administrator expose device health where the workflow happens: Self Service, support triage, local JSON, Splunk, and compliance review.
What it is
Mac Health Check is a managed-device health workflow. It runs on a Mac that is already managed by Jamf or another MDM. It checks local state that MDM administrators care about: macOS version, pending updates, deferred or DDM-enforced updates, SIP, Signed System Volume, firewall, FileVault, Gatekeeper and XProtect, uptime, free disk space, MDM profile state, APNs reachability, Jamf check-in and inventory, network quality, required applications, VPN status, and external checks for tools such as BeyondTrust, Cisco Umbrella, CrowdStrike Falcon, and GlobalProtect.
The point is not to admire the number of checks. The point is to give the MDM administrator a controlled way to surface those checks to the person or system that needs them. In Self Service mode, that means the user and support see a readable swiftDialog result. In Silent mode, that means the organization can collect the same local health signal without putting a dialog in front of the user. In reporting mode, that means the same run can become structured data.
That is the purpose: make local Mac health visible in the MDM workflow. Instead of support guessing whether “the Mac seems weird,” support can ask the user to run Mac Health Check from Self Service. If the result says FileVault is healthy, MDM is healthy, network checks pass, and the only issue is a pending update or missing required app, the support conversation starts from evidence.
It is also useful after remediation. If Tier 2 fixes FileVault, pushes a missing app, repairs MDM, or clears an update problem, running the same health check again gives the user and the technician a shared before-and-after signal.
How it runs
Mac Health Check is a script-driven local workflow that is deployed and triggered by management. The script runs on the Mac, gathers local state, drives swiftDialog for the interface, logs output, and can write structured reporting data. The default production-style experience is Self Service. In that mode, the user opens the organization’s self-service app, launches the Mac Health Check item, and sees the health result. Snelson’s post also documents other operation modes, including Test, Debug, Development, and Silent. That matters because MDM administrators can test visibly before deployment, offer a user-triggered version for support, and later run silent/background checks when reporting matters more than user interaction.
For a first implementation, I would start with the simplest local run on an enrolled, non-production Mac:
cd ~/Downloads/Mac-Health-Check-main
zsh Mac-Health-Check.zsh
That first run answers the questions an MDM administrator needs before building the policy. Does swiftDialog launch? Does the script recognize the MDM state? Does it find the expected security controls? Does it produce a result that support can use? Does it write the local JSON report? Does anything sensitive appear in the output that should be reviewed before central reporting? Only after that works would I package the experience into Self Service.
How I would implement it
The implementation should be treated like an MDM workflow rollout, not a script dump. I would start by testing on one enrolled Mac that looks like the fleet I actually manage. That means the Mac has the expected MDM profile, security baseline, required apps, network access, swiftDialog version, and user context. If the local test fails on that Mac, I would fix the prerequisites before building any policy around it.
Then I would decide what Mac Health Check is supposed to mean in my environment. Its purpose is to expose managed-device health, but not every health signal has the same operational meaning. FileVault, firewall, Gatekeeper, XProtect, MDM profile health, update state, and required security tools may be compliance signals. Disk space, uptime, Wi-Fi quality, VPN, and network reachability may be support triage signals. Required apps can be either, depending on the business.
That distinction matters because the dialog should not simply tell users that the Mac is “bad.” It should tell them what is unhealthy and what the next step is. If a Mac is missing a required app, the next step may be a Self Service install. If FileVault is off, the next step may be a support ticket. If the Mac has not checked into Jamf, the next step may be an MDM repair workflow. If a software update is pending under DDM enforcement, the message should match the update policy instead of creating a duplicate support path.
Once the checks and language make sense, I would create the MDM policy. In Jamf Pro, that means uploading the script, scoping it to a pilot group, confirming swiftDialog is installed before the policy runs, setting the script parameters for the intended operation mode and organization defaults, and making the Self Service item obvious enough that support can say, “Open Self Service and run Mac Health Check.”
That last sentence is the workflow. The tool is most useful when support can trigger it with a simple instruction and then trust that the output is consistent.
What the user sees
In Self Service mode, the user should see a clear health summary, not an admin log. Snelson’s post shows Mac Health Check presenting a results overview, maintenance status, unhealthy results, next steps, and an Inspect Mode summary. The exact styling will depend on the organization’s swiftDialog branding and configuration, but the user experience should answer the same questions every time: is my Mac healthy, what is not healthy, and what should I do next?
That makes the tool different from a silent compliance scan. A silent scan is useful for reporting, but it does not help a user self-correct or give support a shared screen to discuss. A Self Service run can do both. It can tell the user that the Mac needs attention, and it can produce a structured record that support or reporting systems can use later.
The output should also be tuned. If the dialog shows every possible check with no prioritization, it becomes noise. If it shows only a pass/fail result with no next step, it becomes a ticket generator. The useful middle ground is a health result that separates informational signals from warnings and real failures.
What it does with data
Version 4.0.0 is interesting because of the reporting model.
Mac Health Check can write a local JSON report, with Snelson’s post showing /var/tmp/MacHealthCheck-Report.json as the Splunk reporting path. Before I sent that anywhere, I would inspect it locally:
ls -l /var/tmp/MacHealthCheck-Report.json
jq '.metadata, .summary' /var/tmp/MacHealthCheck-Report.json
jq -r '.checks[] | select(.status != "healthy") | "\(.name): \(.status) - \(.message)"' /var/tmp/MacHealthCheck-Report.json
That is the moment where the admin decides whether the report is useful and appropriate. Does it contain the fields needed for support and compliance? Are hostnames, usernames, serial numbers, network details, and security states acceptable for the intended destination? Does the organization need to trim, transform, or classify the data before centralizing it?
If the local JSON is wrong, Splunk will only make the wrong data searchable.
If you use Splunk
If the organization already uses Splunk, Mac Health Check 4.0.0 can become a very useful endpoint health feed. Mac Health Check’s release notes call out optional Splunk HEC delivery, and the example output shows local report generation followed by test mode skipping HEC transmission. That is the right pattern: generate locally first, test delivery second, then promote to production after the data shape is understood.
In a Splunk environment, I would create a test HEC token, send events to a test index and sourcetype, and build a small dashboard before I let the data into a production reporting space. The dashboard does not need to be fancy. It needs to answer operational questions: which Macs reported recently, which checks are failing most often, which devices have unhealthy security controls, which devices have update problems, and which users are repeatedly landing in the same failure state.
The value is not just “Splunk has another feed.” The value is correlation. If Jamf says a device is enrolled, Mac Health Check can show whether the device can actually check in, run policy, report inventory, reach Apple services, and present a user-facing compliance state. If an endpoint security tool reports a device as protected, Mac Health Check can help show whether the required app is present and whether the local Mac state looks sane. If a compliance audit asks how the Mac fleet is monitored, the dashboard can become part of the evidence story.
I would still be careful with the HEC secret. Snelson’s post discusses a client-side cache and LaunchDaemon model, and the project is clearly trying to support reporting without turning every Mac into a place where long-lived reporting secrets are casually exposed. That is the right instinct. Test the cache behavior, test forced fresh runs, and understand where secrets live before calling the deployment done.
If you do not use Splunk
Mac Health Check is still useful without Splunk.
The Self Service run is useful by itself because it gives users and support the same view. The local JSON is useful as a support artifact. The policy log is useful for confirming that the health check ran. In Jamf, you can also decide whether a narrow Extension Attribute should read one high-level result from the local report and return it to inventory, using Jamf’s Computer Extension Attributes model. I would keep that narrow on purpose: overall status, last run time, or a small failed-check summary. I would not try to recreate Splunk inside Jamf inventory.
Without Splunk, the workflow is more support-centered than analytics-centered. A user runs the check. Support reads the dialog or the local report. A Jamf policy log confirms execution. A lightweight inventory attribute can show whether a device has reported a recent health result. That is enough for many environments, especially if the goal is support consistency rather than data warehouse reporting.
The important thing is to choose the workflow intentionally. Splunk is for searchable fleet reporting and dashboards. Local JSON and Self Service are for support workflow and device-level visibility. Jamf inventory can hold a small summary if that helps scope remediation or identify stale devices.
How it ties back to compliance
Compliance is where this tool can be useful, but it should not be oversold. Mac Health Check belongs inside the MDM and compliance program. It is deployed by the management system, runs against managed-device state, and gives the administrator a local health signal that can support enforcement, support, reporting, and audit conversations.
That matters because compliance failures often become operational questions. Is FileVault really on? Is the firewall enabled? Is Gatekeeper and XProtect enabled? Is the Mac seeing the update declaration? Is the MDM profile present? Has Jamf inventory run? Is the required security app installed? Can the Mac reach the services it needs?
Mac Health Check gives those questions a repeatable workflow. A support technician can ask for a run before troubleshooting. An admin can review the JSON. A Splunk dashboard can show trends. A compliance owner can use the results as supporting evidence that managed-device health is visible and actionable.
That is the best way to position it. It is an MDM-delivered compliance visibility and support layer for managed Macs.
The practical takeaway
Mac Health Check 4.0.0 is for MDM administrators who want managed Macs to report their health in a way people can actually use. It runs on the Mac. It is triggered by Self Service or, if configured, silent/background execution. It shows the user a readable swiftDialog result. It gives support a consistent first-pass triage tool. It writes JSON. If Splunk is available, it can feed fleet reporting. If Splunk is not available, it can still improve support and optionally provide a small Jamf inventory signal.
That is the goal: one MDM-delivered health check that connects Self Service, support triage, local JSON, Splunk or non-Splunk reporting, and compliance visibility around the same managed-Mac state.
Sources
- Dan K. Snelson: Mac Health Check 4.0.0
- GitHub: dan-snelson/Mac-Health-Check
- swiftDialog Wiki
- swiftDialog Inspect Mode
- Mac Health Check external checks
- Jamf Pro Computer Extension Attributes
- Jamf Pro Add-on for Splunk
- Jamf: Integrating Splunk with Jamf Pro and Jamf Protect
AI Usage Transparency Report
AI Era · Written during widespread use of AI tools
AI Signal Composition
Score: 0.32 · Moderate AI Influence
Summary
Mac Health Check results
Related Posts

When Chromium Mistakes Your VPN for a Local Network
Turning off Jamf Trust fixed the webinar, which normally would have sent me straight to its routing policies. This time the route was fine: Chromium was treating Jamf's ZTNA broker addresses as a local network, and an Edge and Chrome preference corrected it.

Amnesia Stealer Shows the Next Stage of ClickFix on macOS
Amnesia Stealer shows how ClickFix-style social engineering is adapting on macOS, while a public malware sample gives defenders an opportunity to study the behavior behind the campaign.
Apple Software Updates Need a Blueprint Before the MDM Commands Fade
Apple software update management is moving away from command-first MDM workflows. Jamf Blueprints and Declarative Device Management give Mac admins a better place to express update intent, scope, enforcement, and visibility.

Contour Brings Schema Checks to Mac Admin Configuration Work
Contour is a MacAdmins configuration toolkit that brings schema validation, repeatable generation, normalization, and AI-agent-safe command discovery to Apple configuration profiles, DDM declarations, PPPC, Santa, mSCP, Background Task Management, notifications, support app profiles, and osquery schema lookup.

Three Mac Update Helpers That Fit Below a Patch Platform
Latest, Applite, and an all-in-one macOS update script each solve a different part of lightweight Mac maintenance: app update visibility, Homebrew-backed app management, and command-line package updates that can be wrapped carefully for small teams or basic MDM.
Natural Makes the macOS Scroll Direction Toggle Less Buried
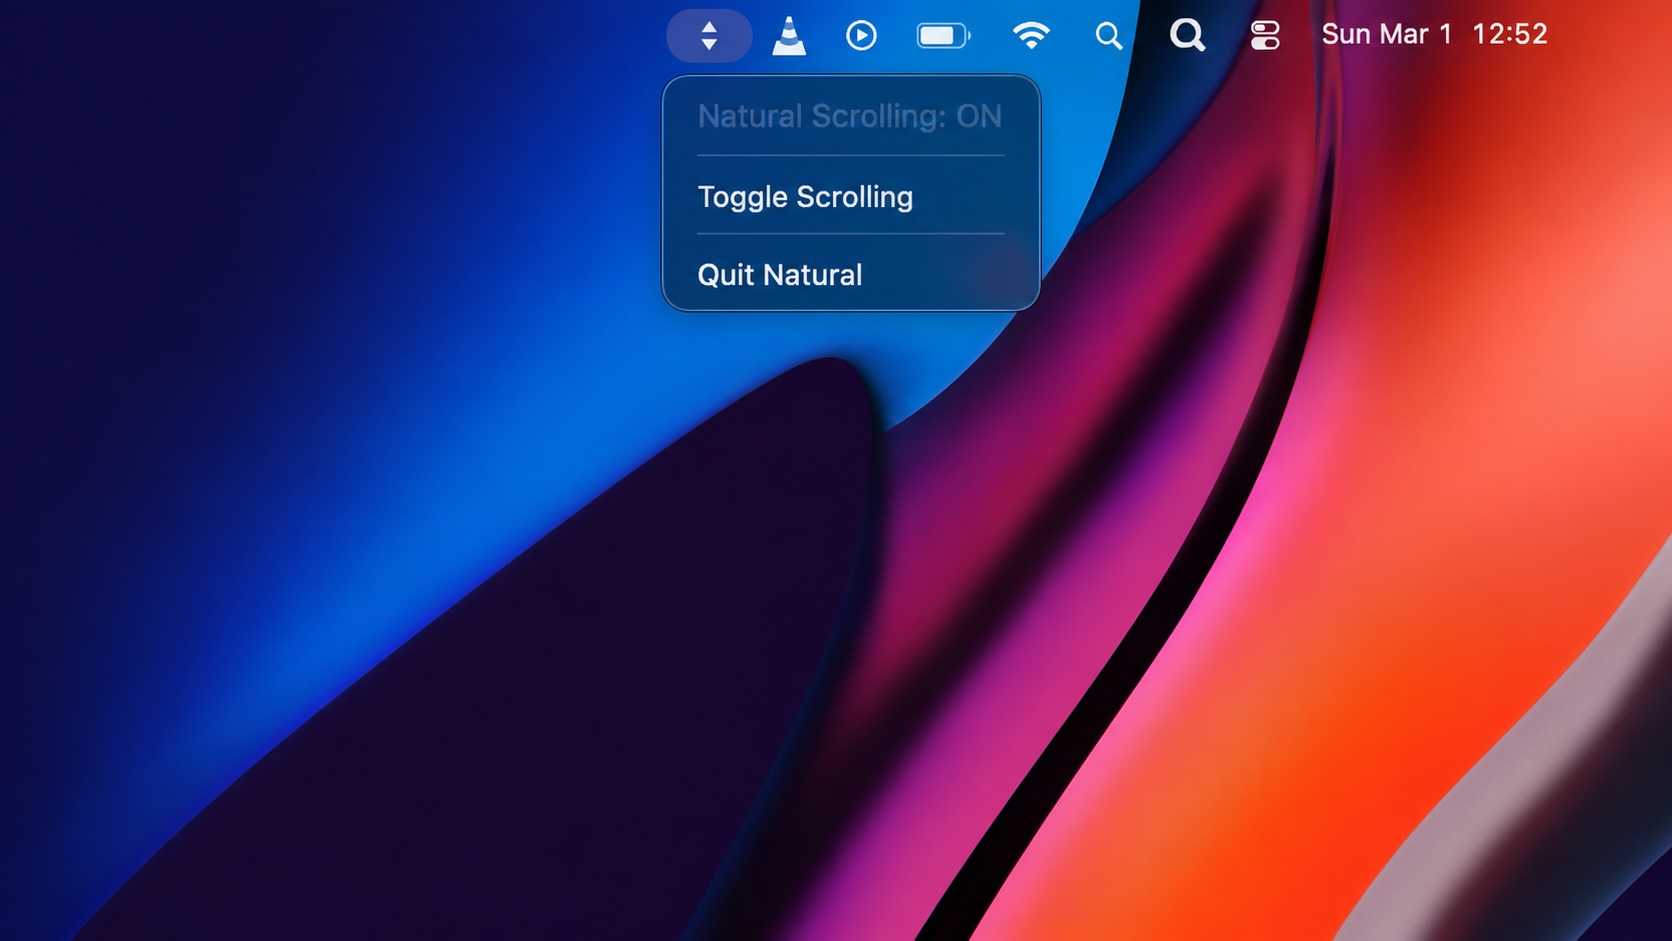
Natural is a small macOS menu bar utility that makes the natural scrolling toggle easy to reach, but building it from source also shows why open-source desktop utilities need clear prerequisite checks before they become recommended tools.

Why Mac Performance Monitor Belongs in the Mac Admin Toolbox
Mac Performance Monitor belongs in the Mac admin toolbox because it records local performance history, helps Help Desk review slow-Mac reports after the moment has passed, and keeps process telemetry on the Mac instead of sending it to a cloud service.

Jamf Moves Platform SSO Into the Enrollment Gate
Jamf's attended Simplified Setup for Platform SSO changes Mac enrollment by making identity registration part of Setup Assistant before the MDM profile is installed.

ClickLock Shows Why Terminal Paste Is a Mac Security Boundary
ClickLock Stealer shows why Mac security teams should watch for Terminal paste lures, fake AppleScript password prompts, command-line Keychain access, LaunchAgent persistence, and Jamf Protect alerts that can route suspected Macs into Jamf Pro response groups.
Deploying DDM OS Reminder 4.0.0 in Jamf
DDM OS Reminder 4.0.0 is deployed as two separate pieces in Jamf: a managed preferences profile and a one-time installer script that creates the reminder script, starter script, and LaunchDaemon heartbeat on the Mac.